Trade
Basic
Futures
Futures
Hundreds of contracts settled in USDT or BTC
TradFi
Gold
Trade global traditional assets with USDT in one place
Options
Hot
Trade European-style vanilla options
Unified Account
Maximize your capital efficiency
Demo Trading
Futures Kickoff
Get prepared for your futures trading
Futures Events
Participate in events to win generous rewards
Demo Trading
Use virtual funds to experience risk-free trading
Earn
Launch
CandyDrop
Collect candies to earn airdrops
Launchpool
Quick staking, earn potential new tokens
HODLer Airdrop
Hold GT and get massive airdrops for free
Launchpad
Be early to the next big token project
Alpha Points
Trade on-chain assets and enjoy airdrop rewards!
Futures Points
Earn futures points and claim airdrop rewards
Investment
Simple Earn
Earn interests with idle tokens
Auto-Invest
Auto-invest on a regular basis
Dual Investment
Buy low and sell high to take profits from price fluctuations
Soft Staking
Earn rewards with flexible staking
Crypto Loan
0 Fees
Pledge one crypto to borrow another
Lending Center
One-stop lending hub
VIP Wealth Hub
Customized wealth management empowers your assets growth
Private Wealth Management
Customized asset management to grow your digital assets
Quant Fund
Top asset management team helps you profit without hassle
Staking
Stake cryptos to earn in PoS products
Smart Leverage
New
No forced liquidation before maturity, worry-free leveraged gains
GUSD Minting
Use USDT/USDC to mint GUSD for treasury-level yields
More
# BTCMarketAnalysis
65.24K
Berserker_09
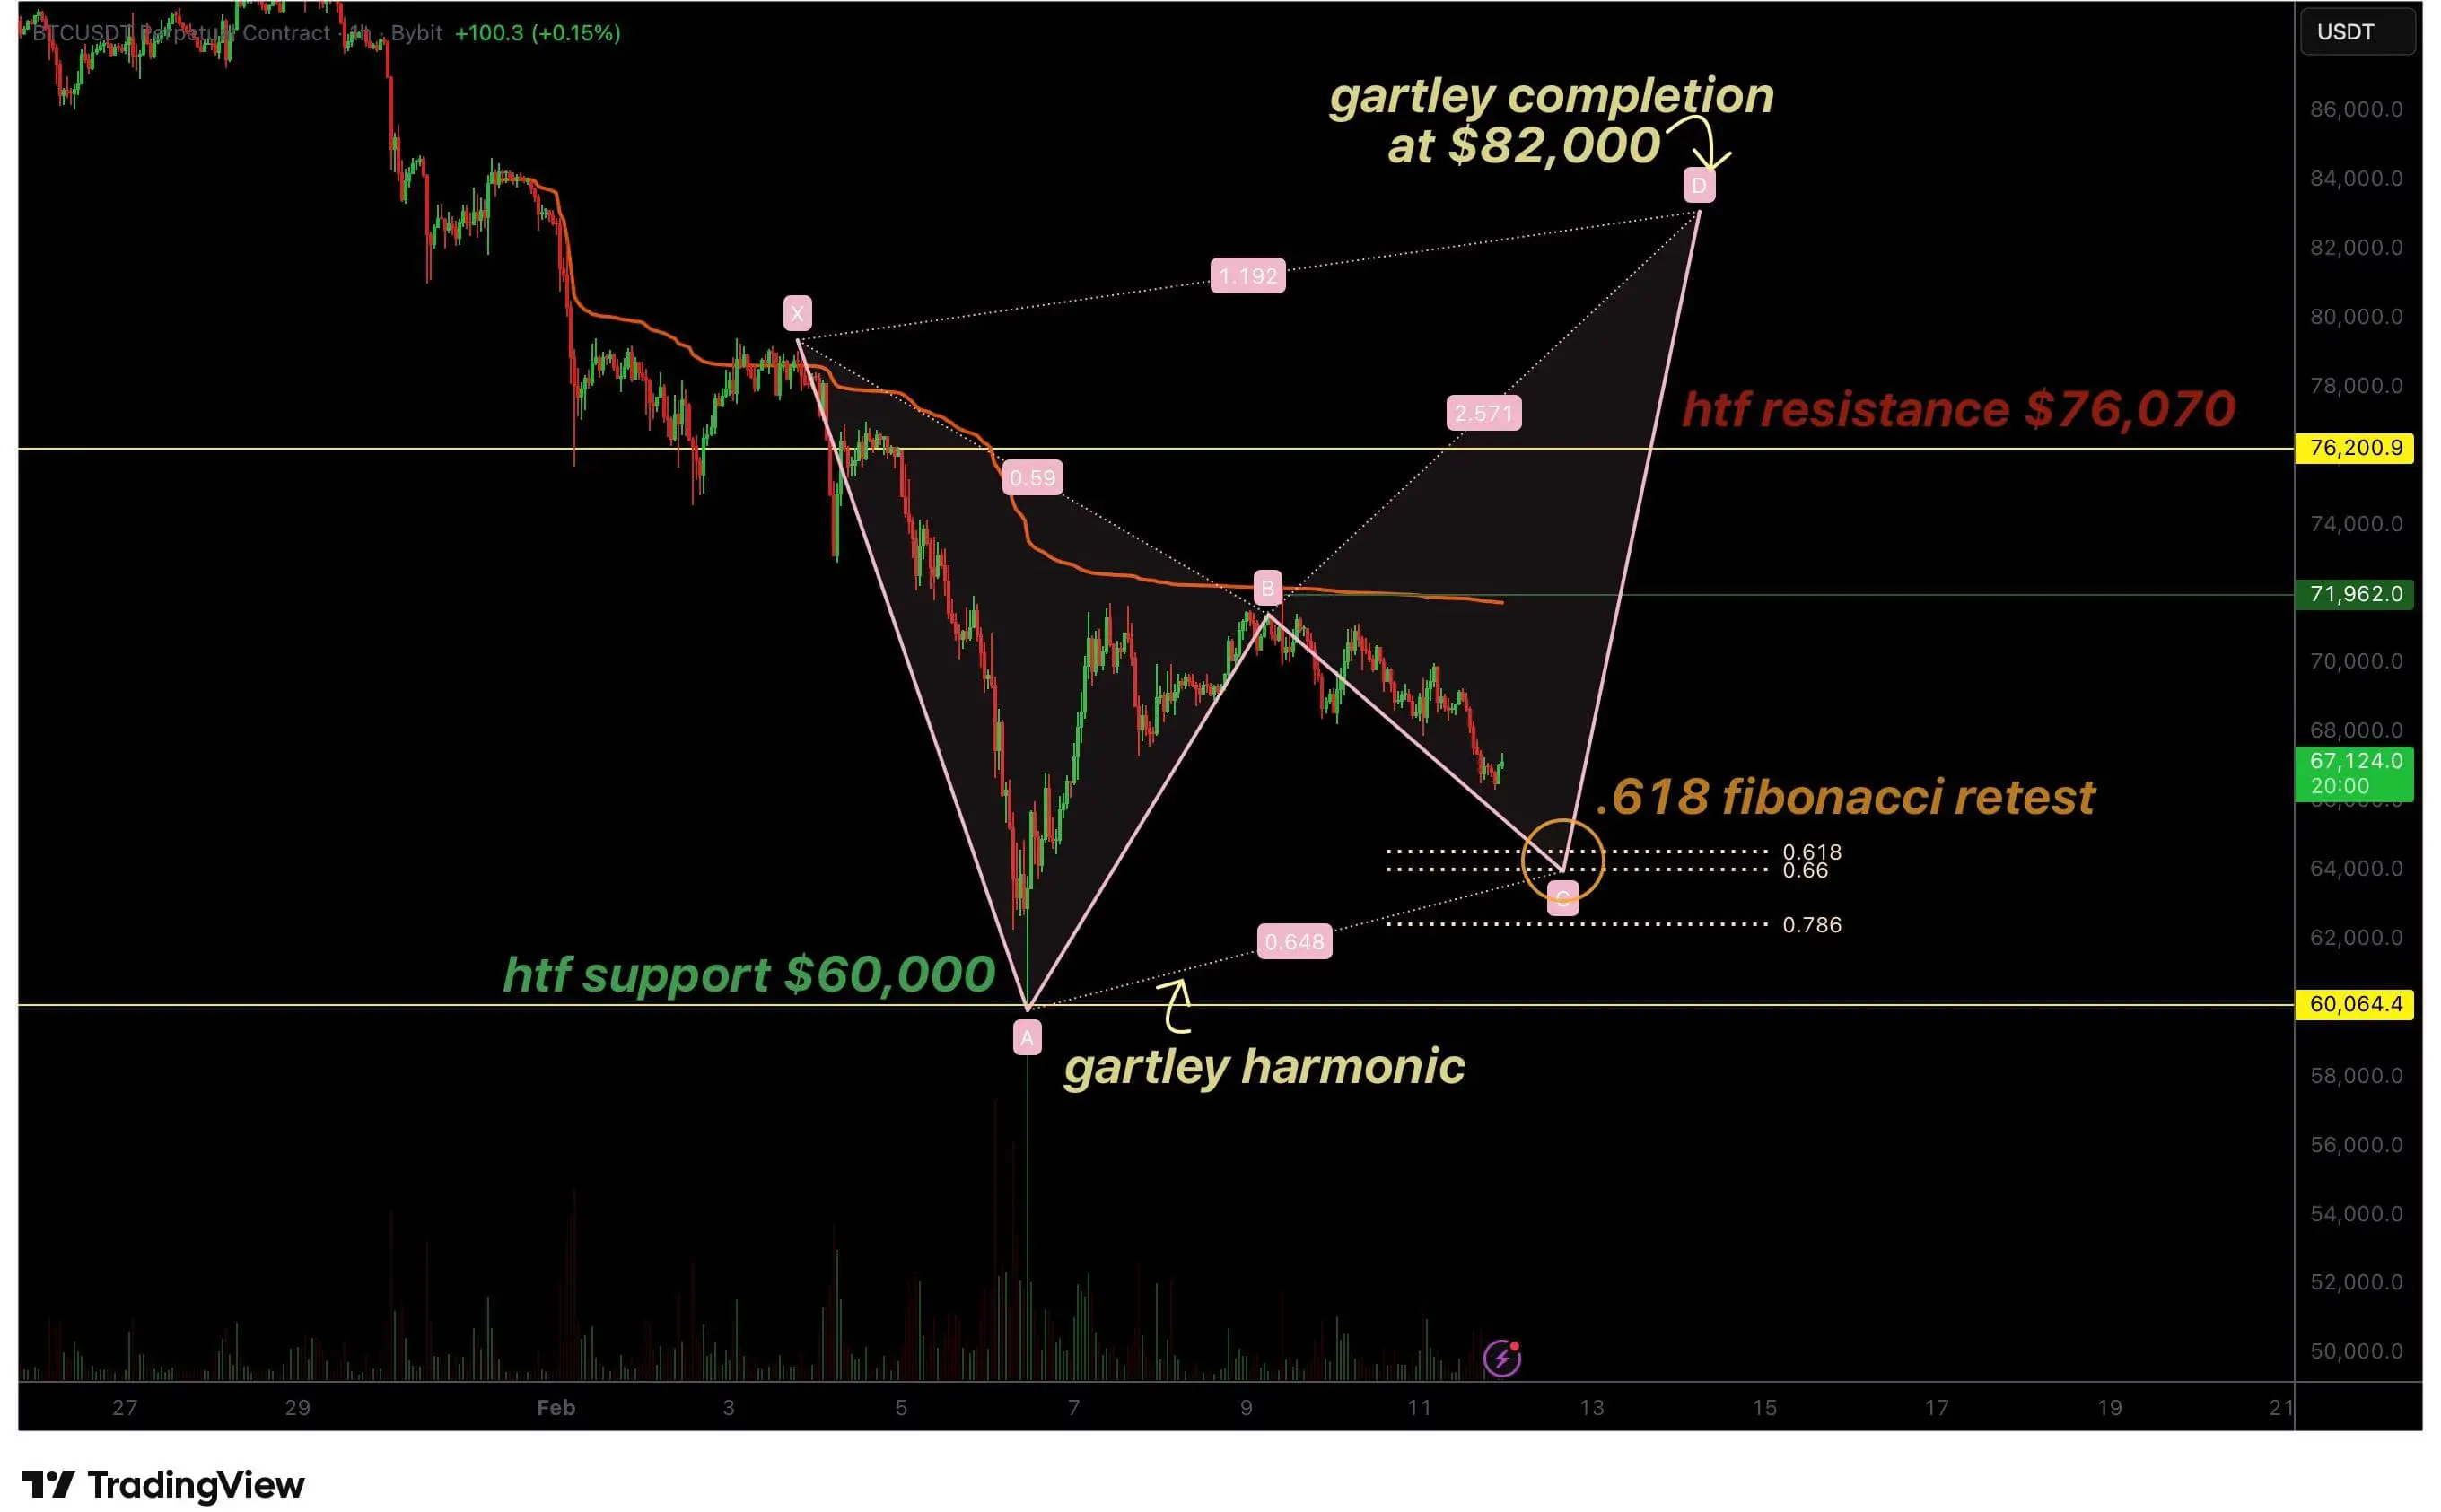
Why Bitcoin price gartley pattern signals potential move toward $80,000
Bitcoin price action is beginning to resemble a developing Gartley harmonic pattern, raising the probability of a technical reversal toward the $80,000–$82,000 region if key Fibonacci support holds.
Bitcoin ( $BTC ) has spent recent sessions consolidating after a sharp corrective move, with price behavior on the intraday timeframe beginning to form a recognizable harmonic structure. While broader market sentiment remains cautious, technical conditions suggest that Bitcoin may be entering a potential reversal zone.
The deve
BTC-1,68%
- Reward
- 1
- Comment
- Repost
- Share
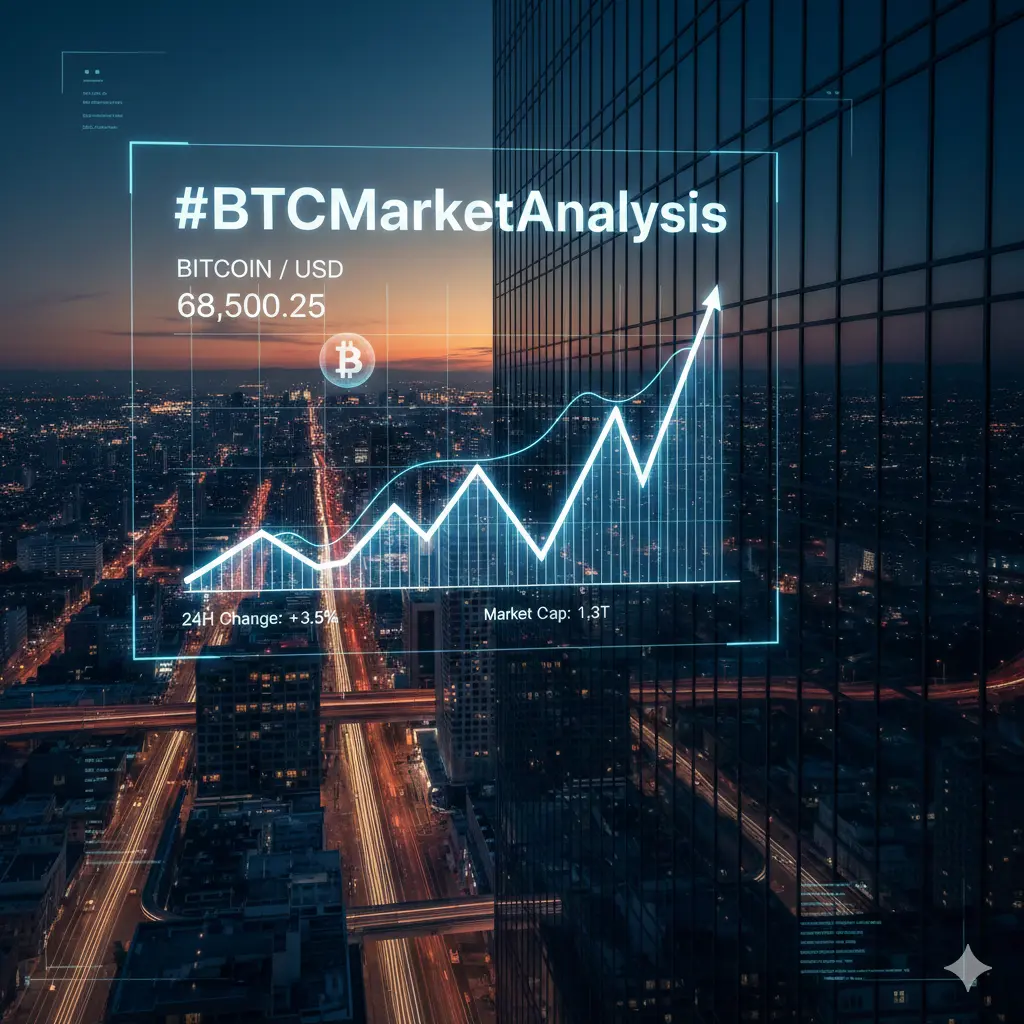
#BTCMarketAnalysis
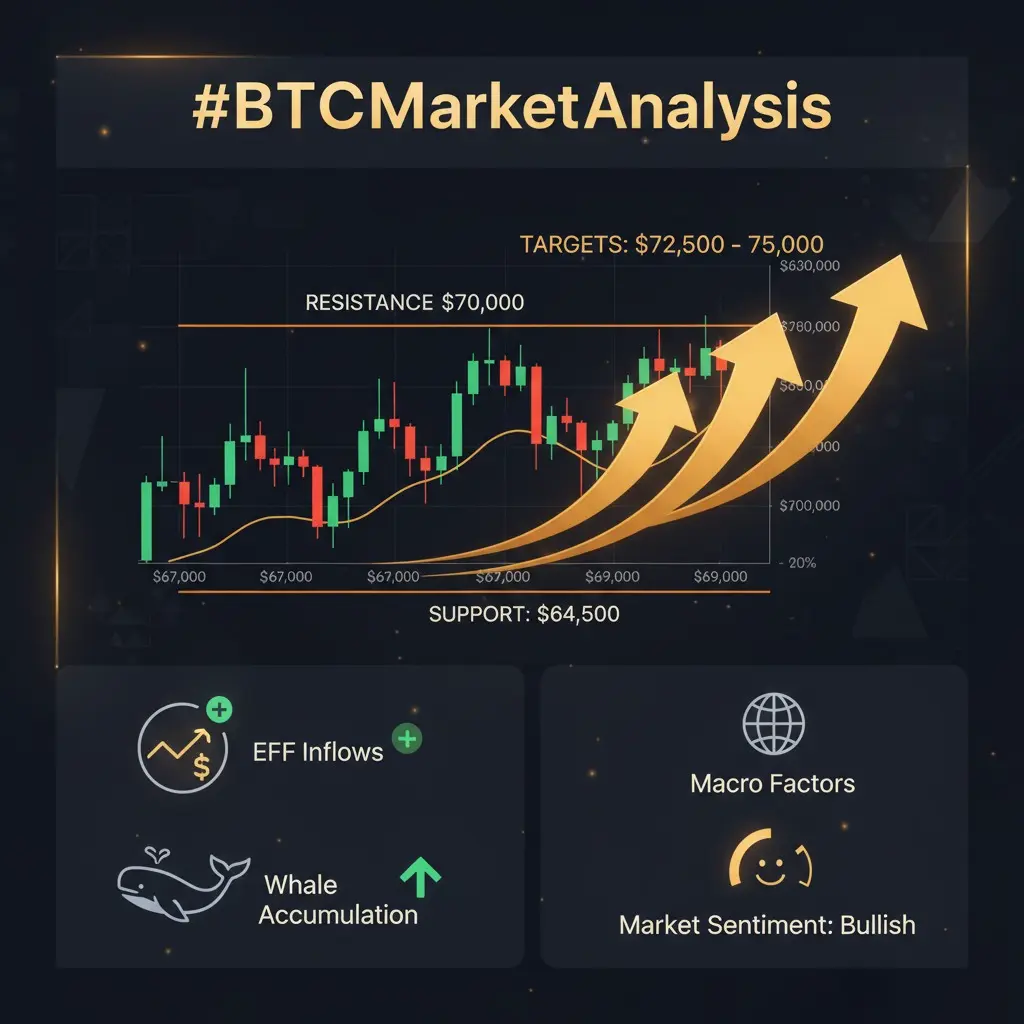
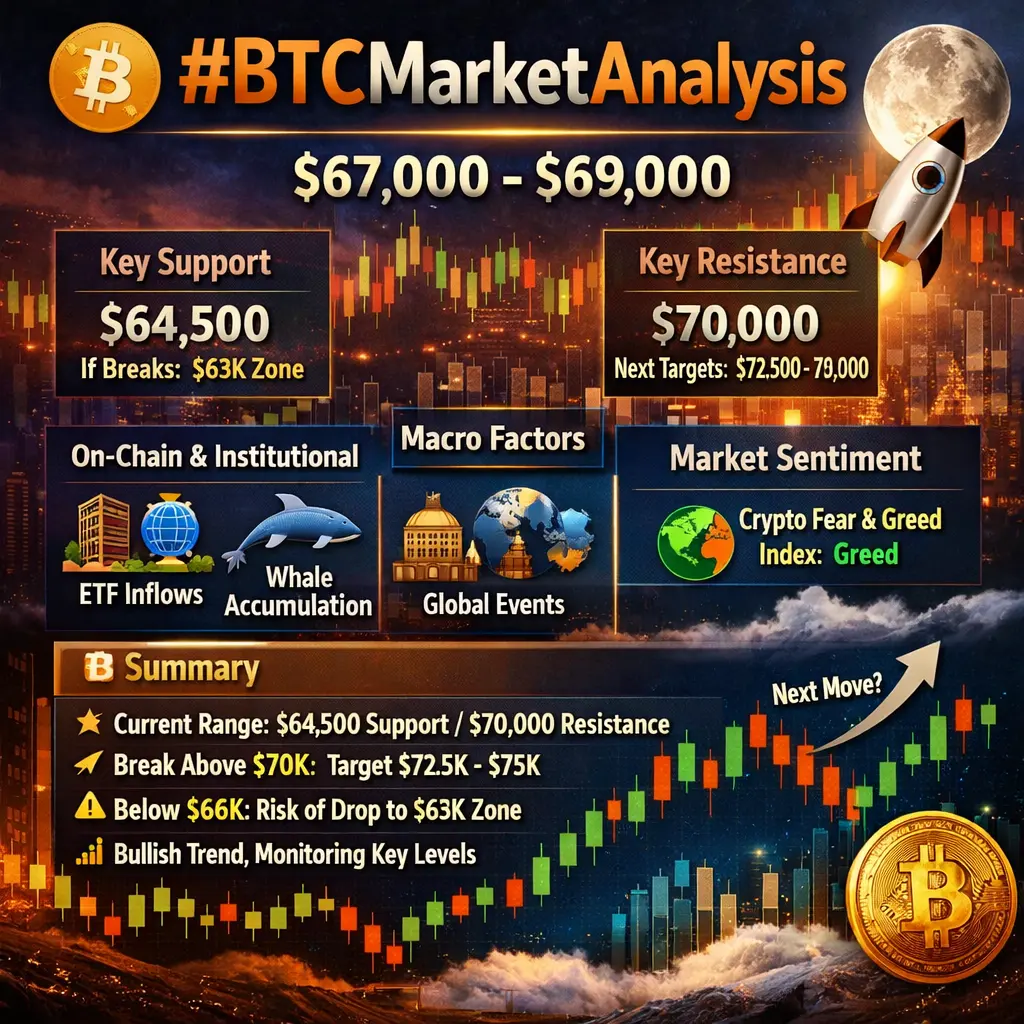
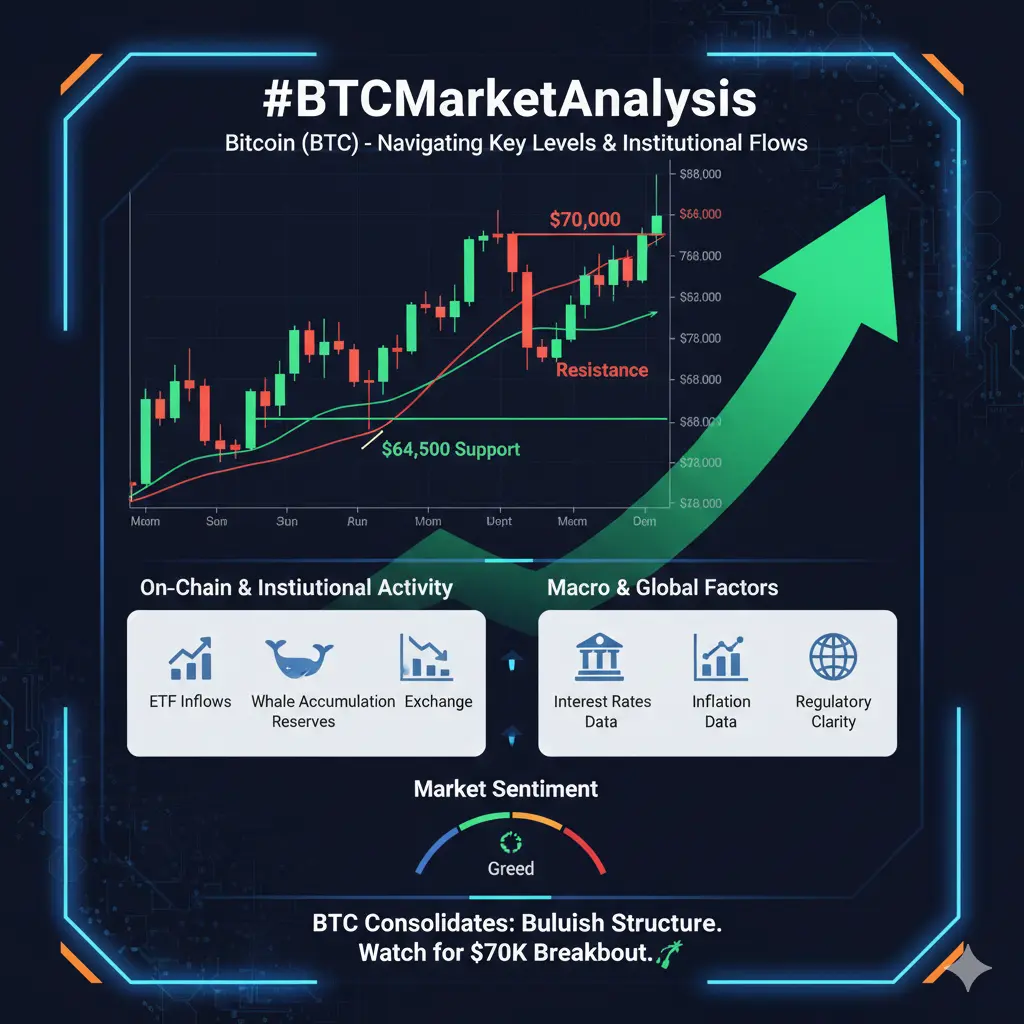
Bitcoin (BTC) continues to dominate the crypto market as the flagship digital asset, setting the tone for overall sentiment and liquidity flows. As of now, BTC is trading around the $67,000–$69,000 range, showing resilience despite short-term volatility. The market structure remains bullish on the higher time frames, although intraday swings reflect profit-taking and macro uncertainty.
Current Market Structure
Bitcoin recently rebounded from a key support zone near $64,500, which acted as a strong demand area backed by institutional buying and ETF inflows. The immediate re
BTC-1,68%
- Reward
- 9
- 17
- Repost
- Share
User_any :
:
2026 GOGOGO 👊View More
#BTCMarketAnalysis Bitcoin’s Current State, Key Levels & What Traders Need to Know
Bitcoin’s market structure in early 2026 reflects a phase of heightened volatility, cautious sentiment, and growing sensitivity to macroeconomic signals. After strong performance in previous cycles, BTC has recently faced renewed selling pressure, pushing price action below the $70,000 level and toward critical short-term support zones. This movement highlights growing uncertainty among traders as global markets wait for clearer direction from economic data and policy expectations.
📉 Current Price Action and Vo
BTC-1,68%

- Reward
- 5
- 4
- Repost
- Share
Ryakpanda:
2026 Go Go Go 👊View More
#BTCMarketAnalysis Bitcoin’s Current State, Key Levels & What Traders Need to Know
Bitcoin’s market structure in early 2026 reflects a phase of heightened volatility, cautious sentiment, and growing sensitivity to macroeconomic signals. After strong performance in previous cycles, BTC has recently faced renewed selling pressure, pushing price action below the $70,000 level and toward critical short-term support zones. This movement highlights growing uncertainty among traders as global markets wait for clearer direction from economic data and policy expectations.
📉 Current Price Action and Vo
Bitcoin’s market structure in early 2026 reflects a phase of heightened volatility, cautious sentiment, and growing sensitivity to macroeconomic signals. After strong performance in previous cycles, BTC has recently faced renewed selling pressure, pushing price action below the $70,000 level and toward critical short-term support zones. This movement highlights growing uncertainty among traders as global markets wait for clearer direction from economic data and policy expectations.
📉 Current Price Action and Vo
BTC-1,68%


[The user has shared his/her trading data. Go to the App to view more.]
- Reward
- 8
- 12
- Repost
- Share
AylaShinex:
Happy New Year! 🤑View More
#BTCMarketAnalysis Bitcoin’s Market Outlook, Critical Levels & What Traders Should Watch
Bitcoin’s market structure in early 2026 is entering a phase marked by higher volatility, cautious investor sentiment, and strong sensitivity to macroeconomic developments. After delivering strong performance in previous cycles, BTC is now facing renewed selling pressure, pushing prices below the $70,000 mark and toward key short-term support zones. This shift reflects growing uncertainty as global markets await clearer signals from economic data and policy direction.
📉 Price Action & Market Volatility
Bi
BTC-1,68%


- Reward
- 3
- 3
- Repost
- Share
Yusfirah:
2026 GOGOGO 👊View More
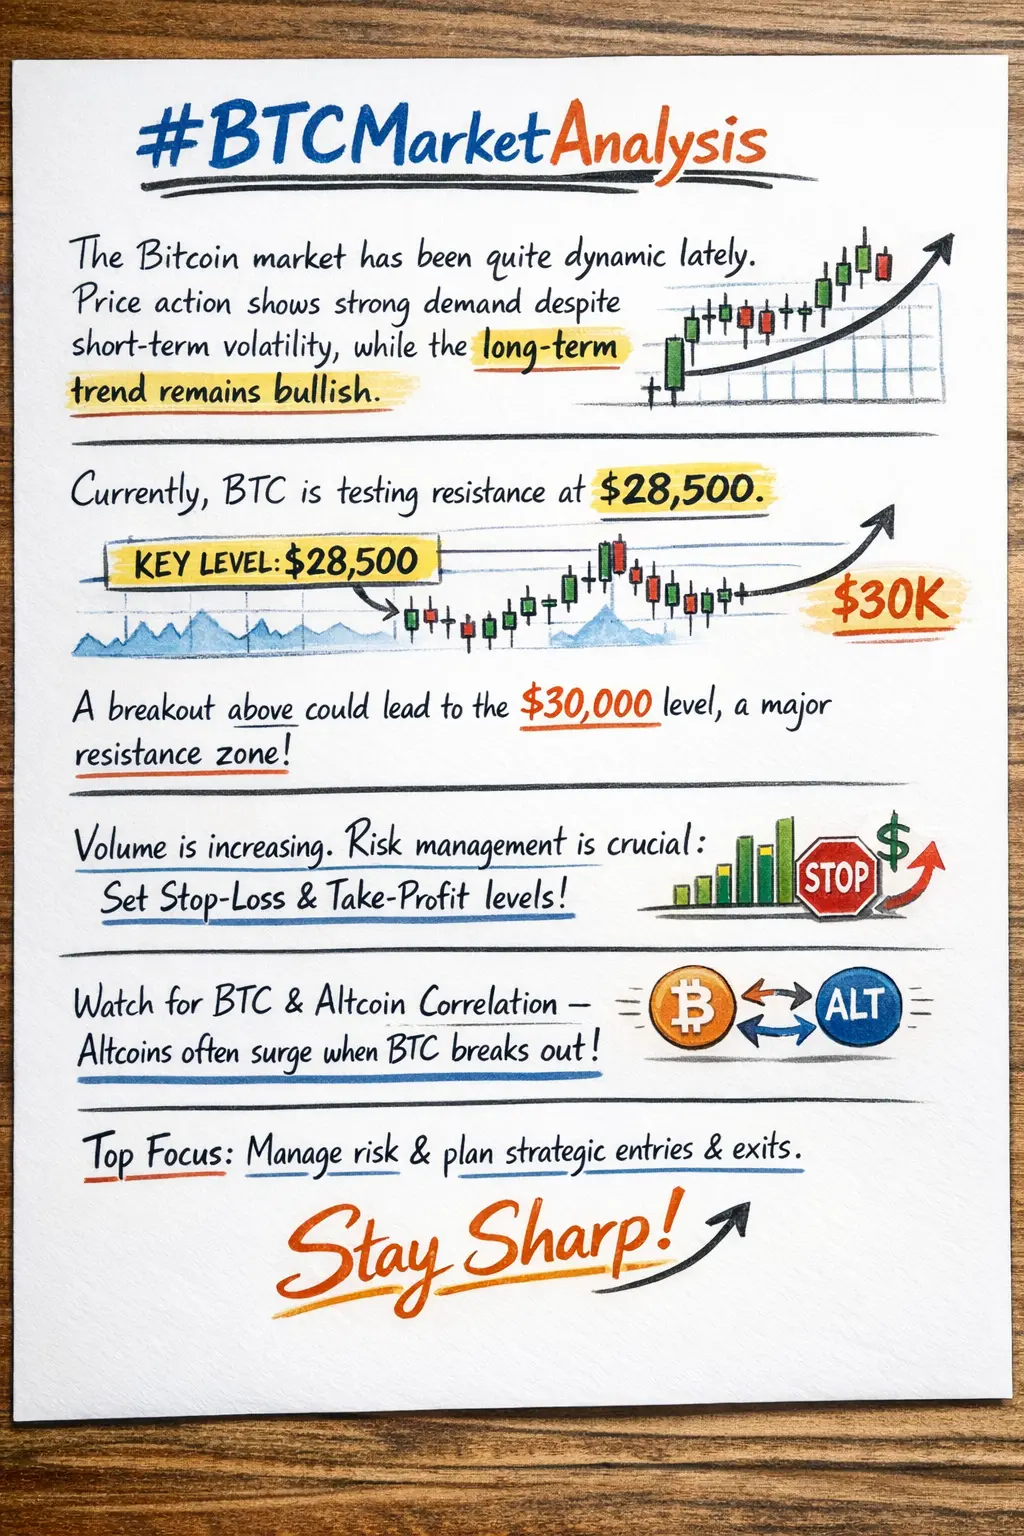
#BTCMarketAnalysis |The Bitcoin market has been showing significant dynamism recently. Recent price action gives a clear insight into the ongoing battle between buyers and sellers, with market sentiment leaning slightly cautious. A close look at the charts shows that Bitcoin has tested multiple support levels and has bounced back each time, signaling that demand remains strong.
For top positioning, it’s essential to understand that despite short-term volatility, the long-term trend continues to favor bullish momentum.
Currently, Bitcoin has challenged the near-term resistance around $28,500 b
For top positioning, it’s essential to understand that despite short-term volatility, the long-term trend continues to favor bullish momentum.
Currently, Bitcoin has challenged the near-term resistance around $28,500 b
BTC-1,68%
- Reward
- 3
- 3
- Repost
- Share
MasterChuTheOldDemonMasterChu :
:
Thank you for sharing the information; it was very inspiring to me💪💪💪View More
Market Volatility Is Rising — Has the BTC Playbook Changed?
Bitcoin volatility is picking up again, and that usually signals transition, not randomness. After a period of compression, price is reacting faster to macro headlines, liquidity shifts, and derivatives positioning.
🔍 What’s different now
Shorter swings: BTC is respecting intraday levels more tightly, making patience and timing more important than prediction.
Liquidity-driven moves: Wicks are sharper as leverage builds on both sides — fake breakouts are more common.
Macro sensitivity: Yields, USD moves, and risk sentiment are having
BTC-1,68%

- Reward
- 19
- 15
- Repost
- Share
repanzal:
2026 GOGOGO 👊View More
#BTCMarketAnalysis
✅ Viral Style Post (Gate.io)
🚀 #BTCMarketAnalysis
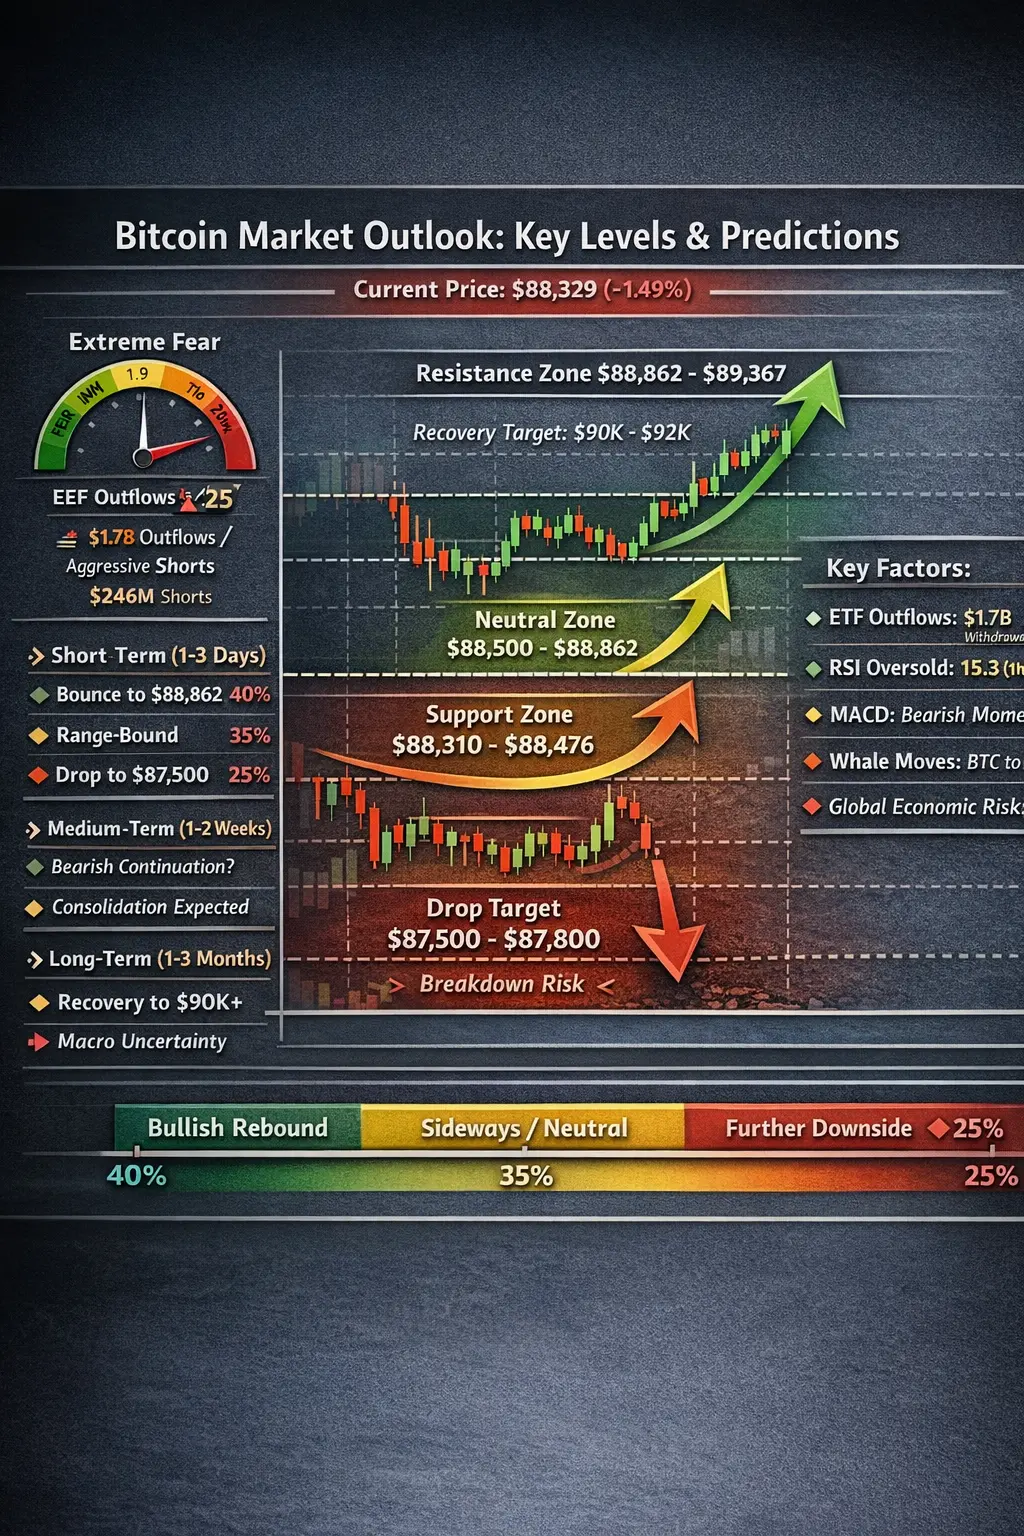
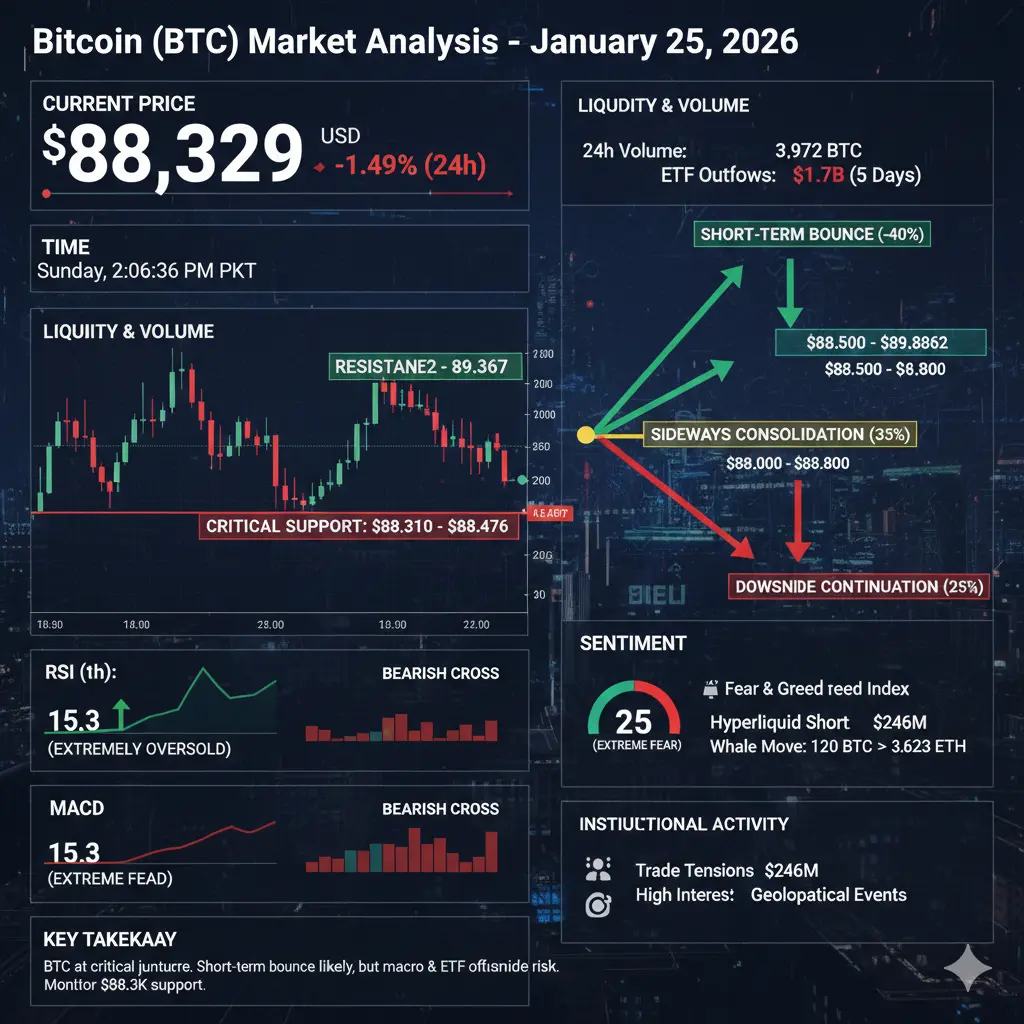
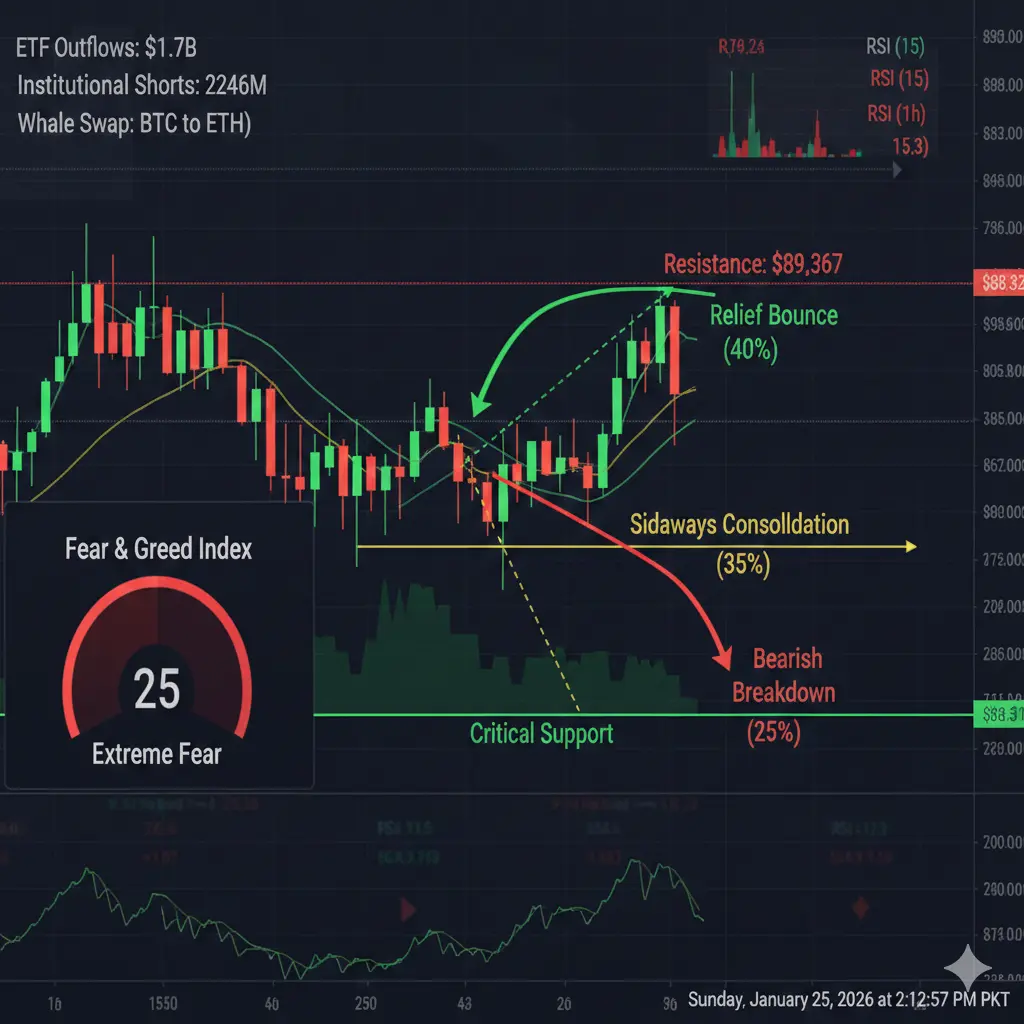
Bitcoin is in extreme fear mode, trading at $88,329 and down 1.49% in 24h.
The market is flooded with ETF outflows ($1.7B in 5 days) and heavy institutional shorts, making short-term downside likely.
📌 Key Support: $88,310 – $88,476
📌 Key Resistance: $88,862 – $89,367
🔥 My Take:
BTC is oversold (RSI 15.3) — so a small bounce (0.5–1.5%) is possible if support holds.
But if it breaks $88,310, we may drop further toward $87,500–$87,800.
💡 The real signal:
Fear & Greed Index at 25 (Extreme Fear) → possible local bottom, but
✅ Viral Style Post (Gate.io)
🚀 #BTCMarketAnalysis
Bitcoin is in extreme fear mode, trading at $88,329 and down 1.49% in 24h.
The market is flooded with ETF outflows ($1.7B in 5 days) and heavy institutional shorts, making short-term downside likely.
📌 Key Support: $88,310 – $88,476
📌 Key Resistance: $88,862 – $89,367
🔥 My Take:
BTC is oversold (RSI 15.3) — so a small bounce (0.5–1.5%) is possible if support holds.
But if it breaks $88,310, we may drop further toward $87,500–$87,800.
💡 The real signal:
Fear & Greed Index at 25 (Extreme Fear) → possible local bottom, but
BTC-1,68%

- Reward
- 1
- Comment
- Repost
- Share
#BTCMarketAnalysis
Bitcoin (BTC) continues to show high volatility, currently trading at $88,329, down 1.49% in the last 24 hours. Market sentiment is dominated by extreme fear, fueled by institutional outflows, aggressive short positions, and macroeconomic uncertainties. This analysis will break down price action, liquidity, volume, sentiment, technical structure, and future predictions to provide a clear market picture.
🔹 Price Action and Percentage Movements
Current Price: $88,329
24h High/Low: $89,673.50 / $88,128.40 → a $1,545 intra-day range (~1.75% movement).
Recent Drop: From $89,657
- Reward
- 36
- 22
- Repost
- Share
MissCrypto:
2026 GOGOGO 👊View More
#BTCMarketAnalysis
✅ Viral Style Post (Gate.io)
🚀 #BTCMarketAnalysis
Bitcoin is in extreme fear mode, trading at $88,329 and down 1.49% in 24h.
The market is flooded with ETF outflows ($1.7B in 5 days) and heavy institutional shorts, making short-term downside likely.
📌 Key Support: $88,310 – $88,476
📌 Key Resistance: $88,862 – $89,367
🔥 My Take:
BTC is oversold (RSI 15.3) — so a small bounce (0.5–1.5%) is possible if support holds.
But if it breaks $88,310, we may drop further toward $87,500–$87,800.
💡 The real signal:
Fear & Greed Index at 25 (Extreme Fear) → possible local bottom, but
BTC-1,68%

- Reward
- 6
- 1
- Repost
- Share
LeoStar:
2026 GOGOGO 👊Load More
Join 40M users in our growing community
⚡️ Join 40M users in the crypto craze discussion
💬 Engage with your favorite top creators
👍 See what interests you
Trending Topics
242.34K Popularity
55.79K Popularity
29.07K Popularity
22.57K Popularity
19.98K Popularity
121.5K Popularity
7.72K Popularity
13.2K Popularity
6.77K Popularity
5.79K Popularity
6.94K Popularity
17.68K Popularity
4.21K Popularity
23.5K Popularity
15.61K Popularity
News
View MoreAlameda Research bankruptcy liquidation address exchanges 129 million STG for ZRO, worth $24.29 million
1 m
Offshore RMB against the US dollar breaks through the 6.9 level, continuing to hit a new high in 2023
5 m
"Maqi" is no longer bearish and has closed all limit ETH short positions.
7 m
Ripple CEO: Not ruling out the possibility of restarting mergers and acquisitions in the second half of the year
9 m
S (Sonic) has increased by 20.82% in the past 24 hours, with a market capitalization of approximately $141 million.
10 m
Pin