Trade
Basic
Futures
Futures
Hundreds of contracts settled in USDT or BTC
TradFi
Gold
Trade global traditional assets with USDT in one place
Options
Hot
Trade European-style vanilla options
Unified Account
Maximize your capital efficiency
Demo Trading
Futures Kickoff
Get prepared for your futures trading
Futures Events
Participate in events to win generous rewards
Demo Trading
Use virtual funds to experience risk-free trading
Earn
Launch
CandyDrop
Collect candies to earn airdrops
Launchpool
Quick staking, earn potential new tokens
HODLer Airdrop
Hold GT and get massive airdrops for free
Launchpad
Be early to the next big token project
Alpha Points
Trade on-chain assets and enjoy airdrop rewards!
Futures Points
Earn futures points and claim airdrop rewards
Investment
Simple Earn
Earn interests with idle tokens
Auto-Invest
Auto-invest on a regular basis
Dual Investment
Buy low and sell high to take profits from price fluctuations
Soft Staking
Earn rewards with flexible staking
Crypto Loan
0 Fees
Pledge one crypto to borrow another
Lending Center
One-stop lending hub
VIP Wealth Hub
Customized wealth management empowers your assets growth
Private Wealth Management
Customized asset management to grow your digital assets
Quant Fund
Top asset management team helps you profit without hassle
Staking
Stake cryptos to earn in PoS products
Smart Leverage
New
No forced liquidation before maturity, worry-free leveraged gains
GUSD Minting
Use USDT/USDC to mint GUSD for treasury-level yields
More
Bit_Hunterrr
No content yet
Bit_Hunterrr
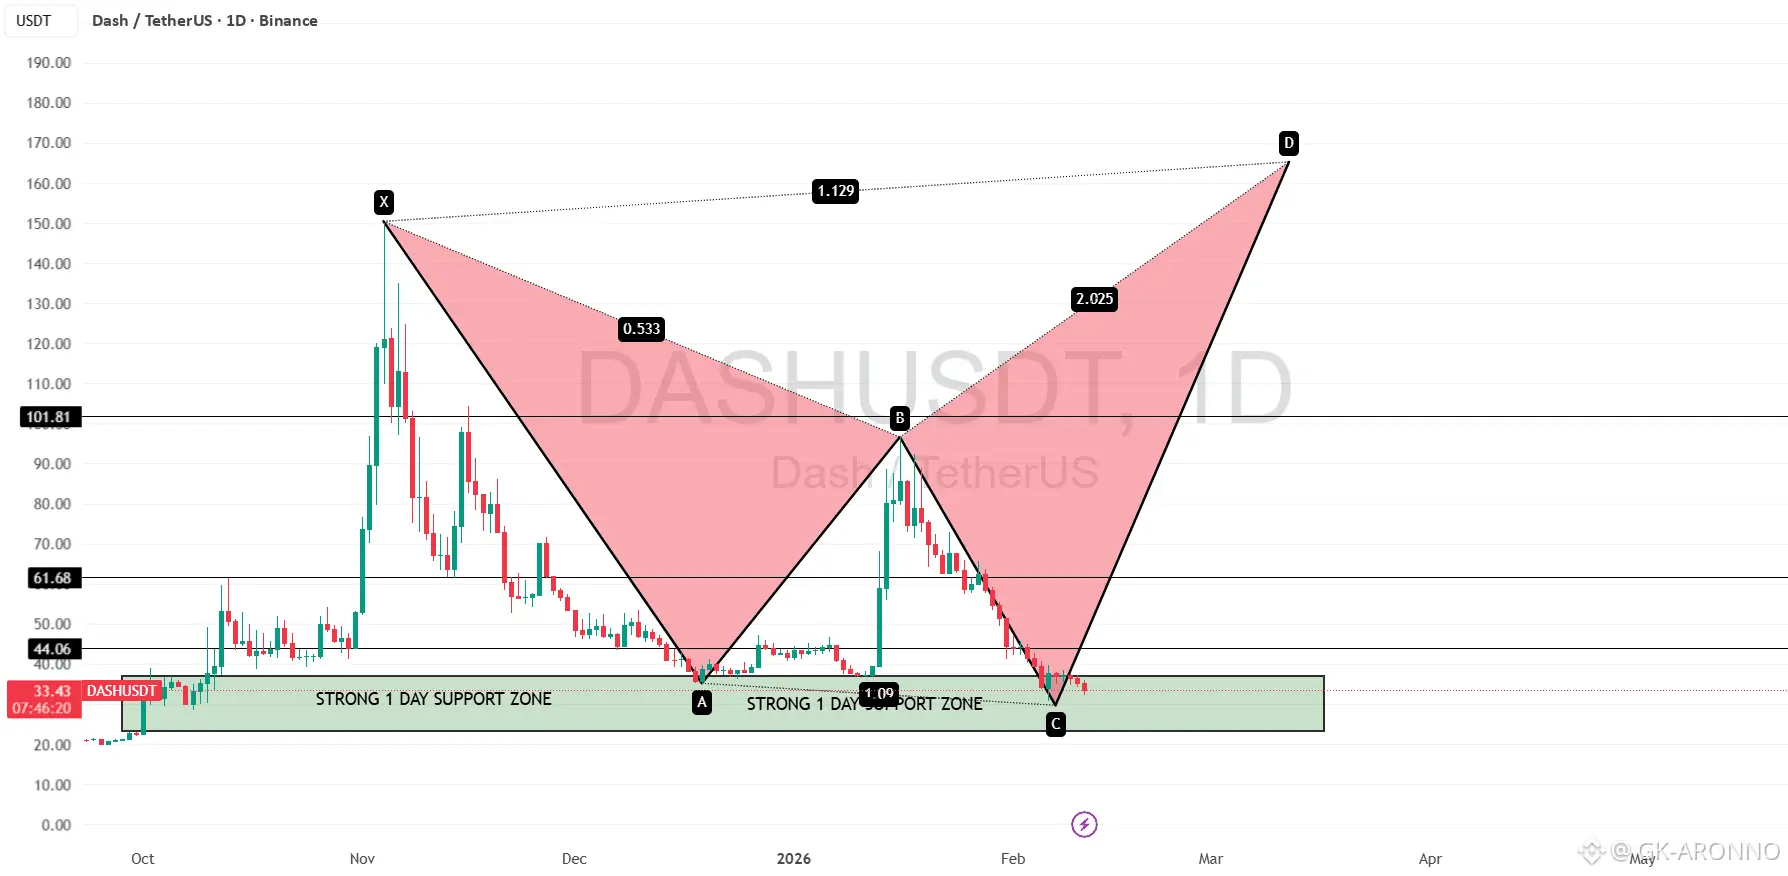
DASH Ready for a Major Reversal ?? 100$ again ??
DASH 1D CHART UPDATE ✅
📌DASH is currently forming a clear harmonic chart pattern on the daily timeframe, indicating a potential reversal structure in progress ✅
📌Price is now consolidating inside a strong daily support zone, which previously acted as a demand area for buyers ✅
📌As long as this support zone holds, DASH has a high probability of moving upward and starting a recovery move ✅
📌A bounce from this area could push the price toward the mid resistance levels first, followed by a larger upside continuation if momentum builds ✅
📌Final
DASH-2,97%
- Reward
- 1
- Comment
- Repost
- Share
$BTC is still aiming for a move toward $80K. If that level breaks, $88K–$90K becomes the next upside zone....
The key decision points are the OB1 and OB2 areas price reaction there will define the next trend....
Two possible paths:
If $BTC holds above the recent $60K low, the odds favor a push toward $80K in the coming days....
If $60K fails before $80K is tested, a drop below $50K becomes likely, which would mark a major accumulation zone.
Patience is crucial here. Let the chart confirm the move before acting.$BTC
BTC-2,13%
- Reward
- 1
- Comment
- Repost
- Share
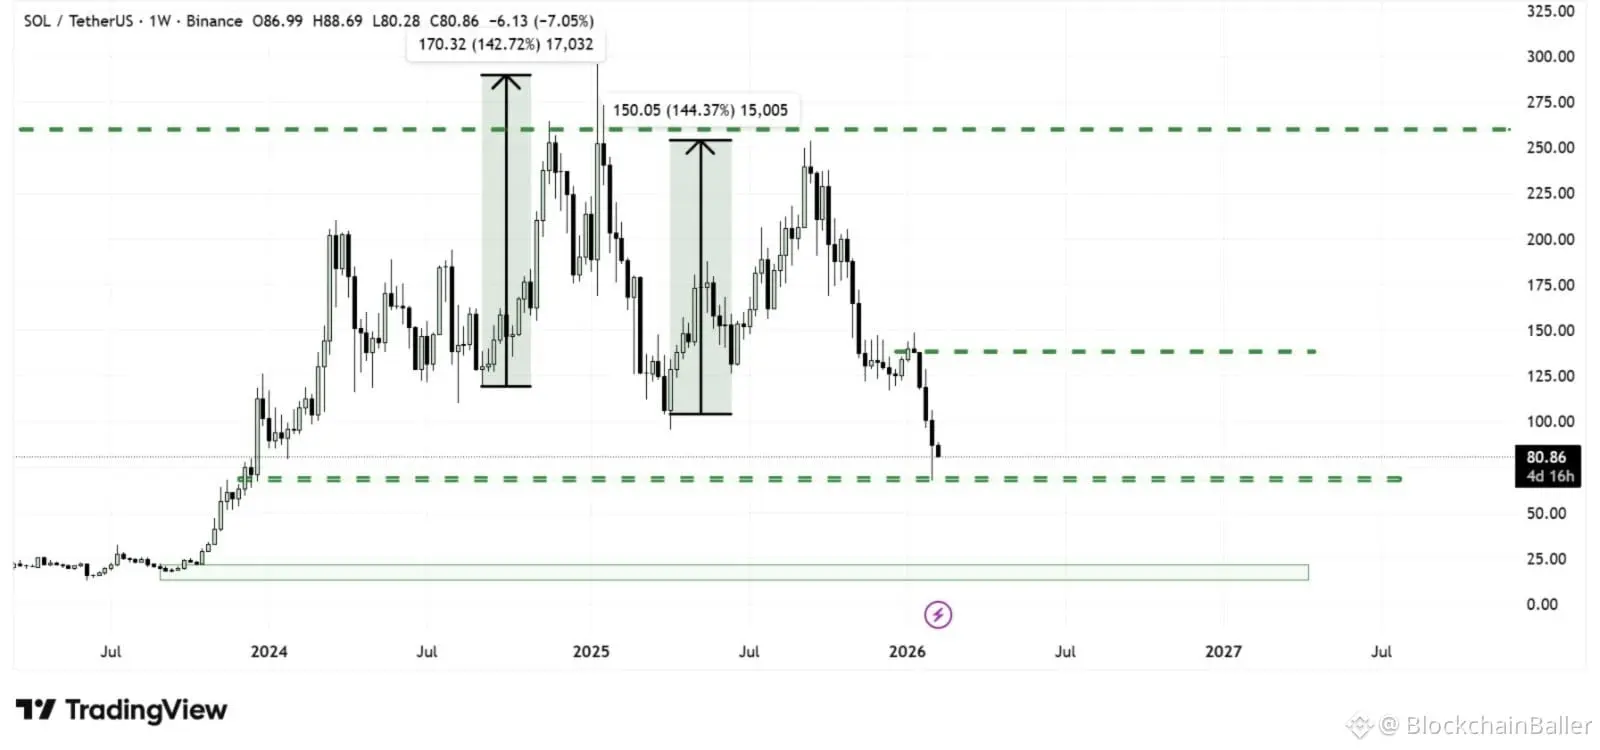
I called this weeks ago $SOL was heading toward the $50–$70 zone, and it dumped right to $67. Accumulation area tagged perfectly.
If we see more downside, $50 is the ideal buy zone. Long-term outlook stays the same: $500–$1,000.
While others doubted it, smart money steps in when fear takes over.$SOL
If we see more downside, $50 is the ideal buy zone. Long-term outlook stays the same: $500–$1,000.
While others doubted it, smart money steps in when fear takes over.$SOL
SOL-3,98%
- Reward
- like
- Comment
- Repost
- Share
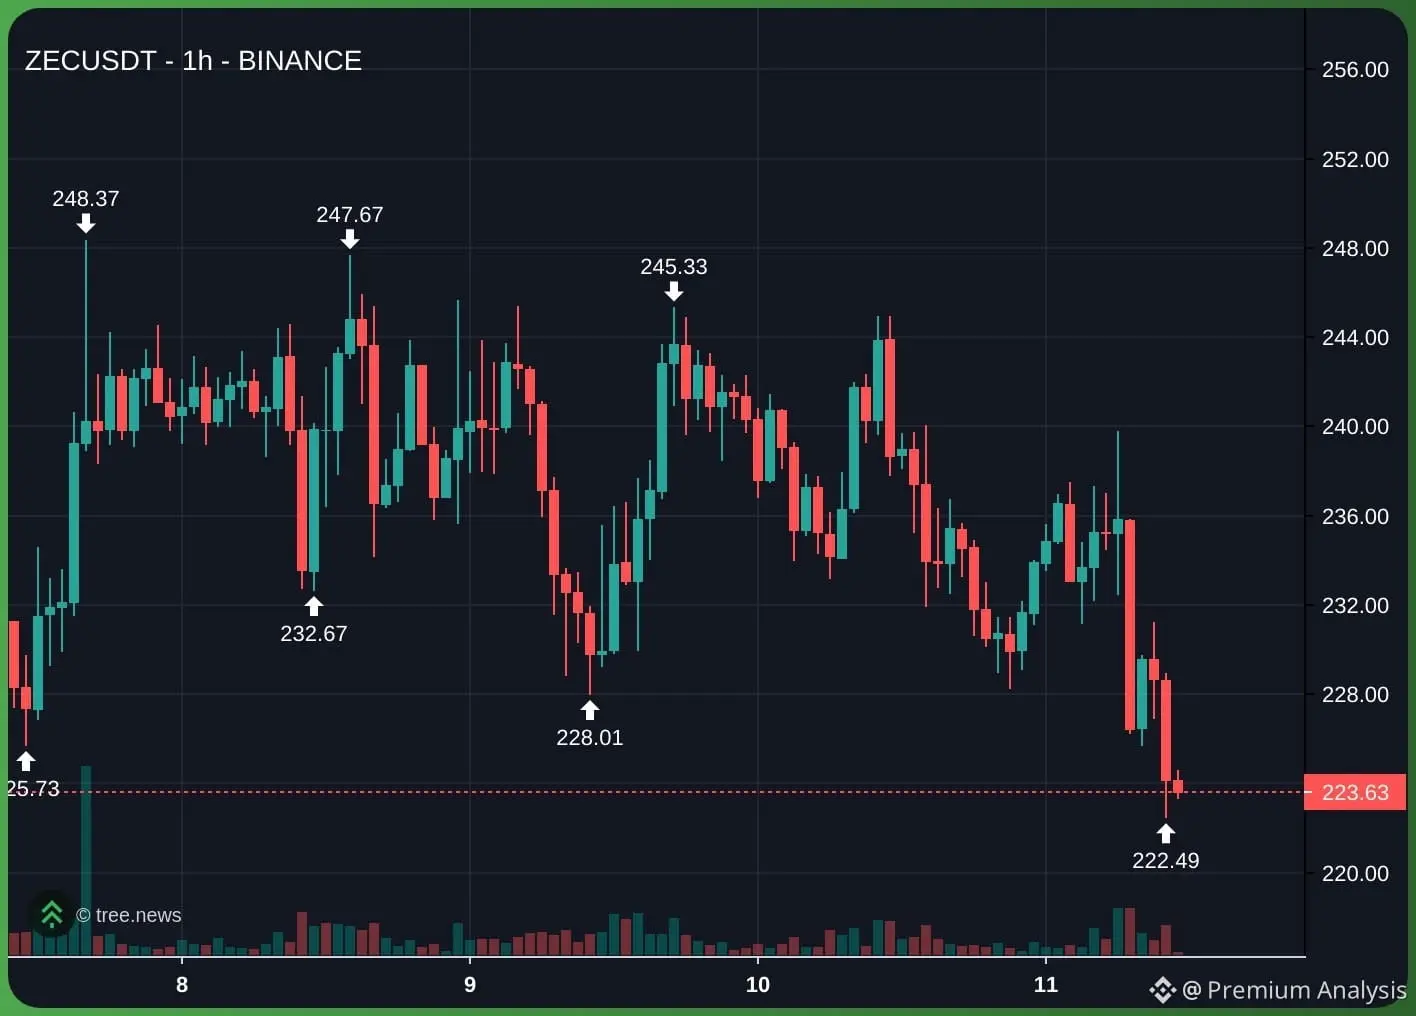
$ZEC Clear Downtrend
Recent K-line shows increased volume during downward moves, confirming selling pressure. The last few candles have low volume, suggesting a lack of buying interest.
Capital Flow: Consistent net outflows in both spot and contract markets over short timeframes (-504K in 5m for contracts, -45K in 5m for spot). Longer-term outflows (24h: -9.5M for contracts, -4.8M for spot) reinforce bearish momentum.
Entry short $ZEC : current levels 223 or on a minor pullback to 225-227 (test of broken support turned resistance).
Stop Loss: Set at 233 (just above MA5 and recent resistance
ZEC3,38%
- Reward
- like
- Comment
- Repost
- Share
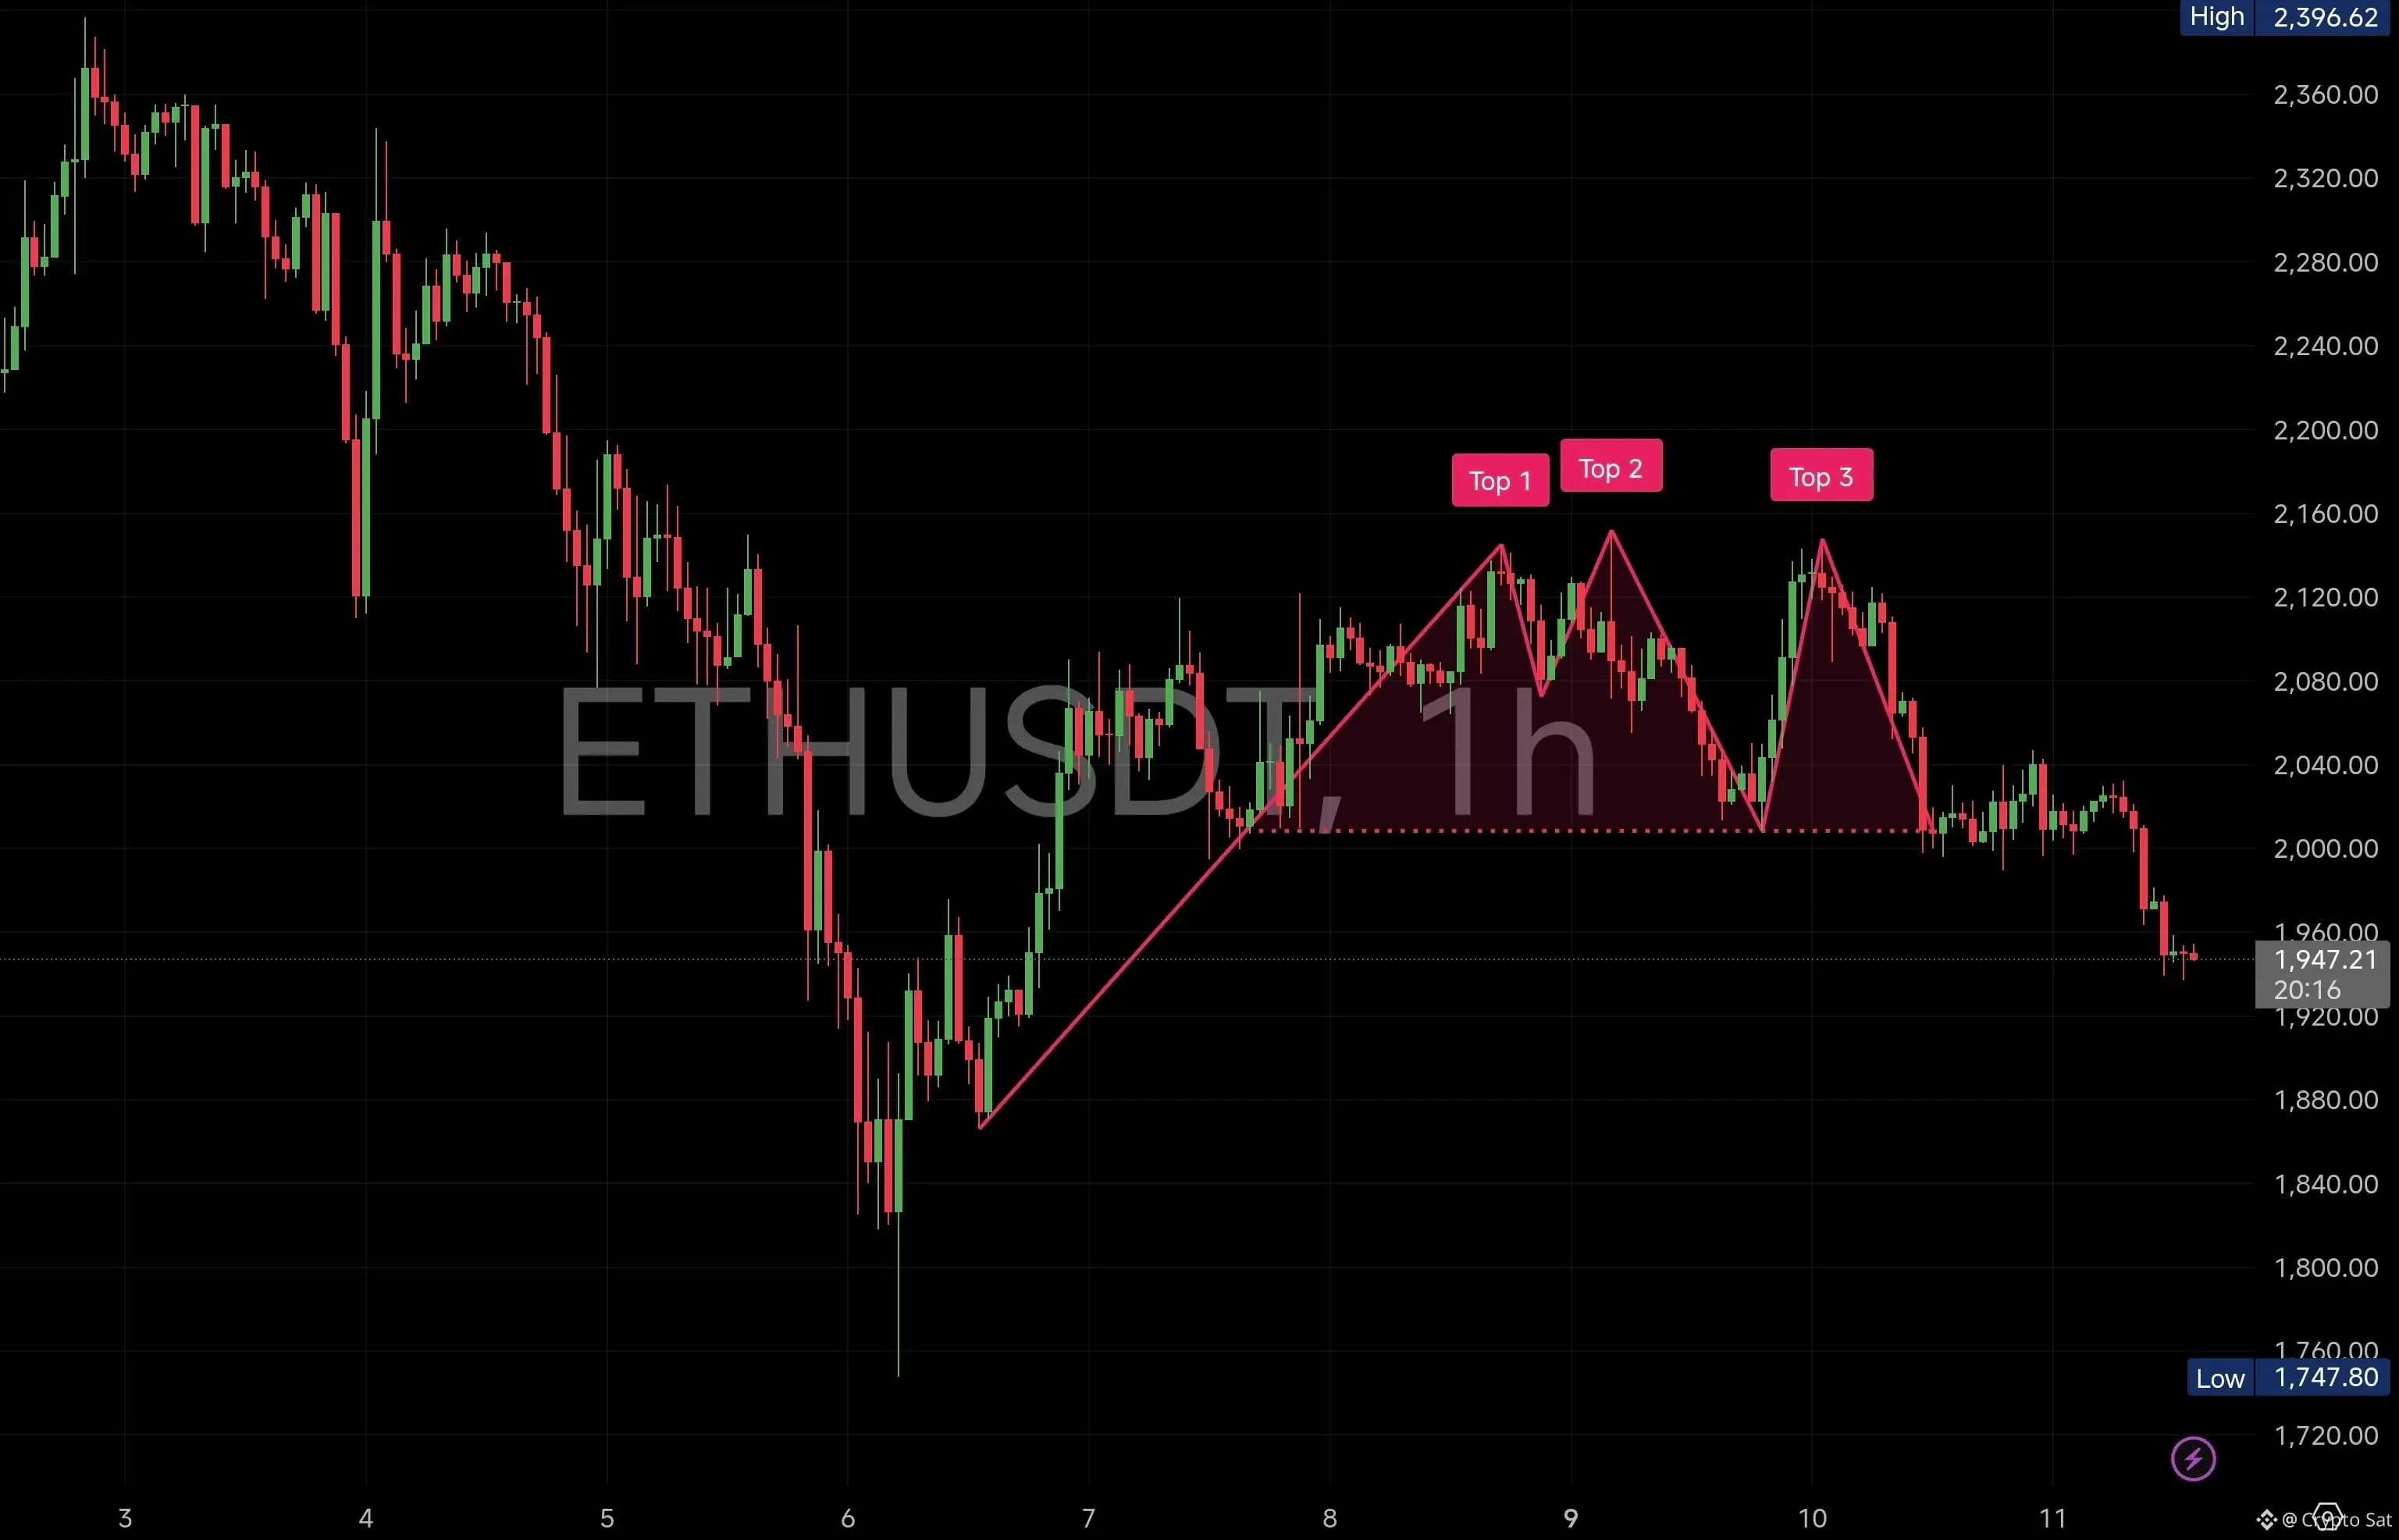
$ETH has officially lost the 2000–2020 base we highlighted on the 1H chart.
Triple-top rejection (Top 1 → Top 2 → Top 3) played out perfectly — buyers failed at the 2140–2160 supply zone, and breakdown followed.
📍 First reaction target (1980–1950) ✅ Hit
That’s roughly a 2.6–3% move from breakdown level, which is 26–30% profit on 10x leverage 💥
Momentum is clearly tilted downside after repeated rejections.
Next Target zones remain:
➡️ 1900–1850 (previous impulse base)
➡️ 1800–1750 (HTF demand / liquidity)
If you entered on breakdown — shift SL to entry now and protect gains.
Let the rest run
ETH-3,45%
- Reward
- 1
- 1
- Repost
- Share
JioCoins:
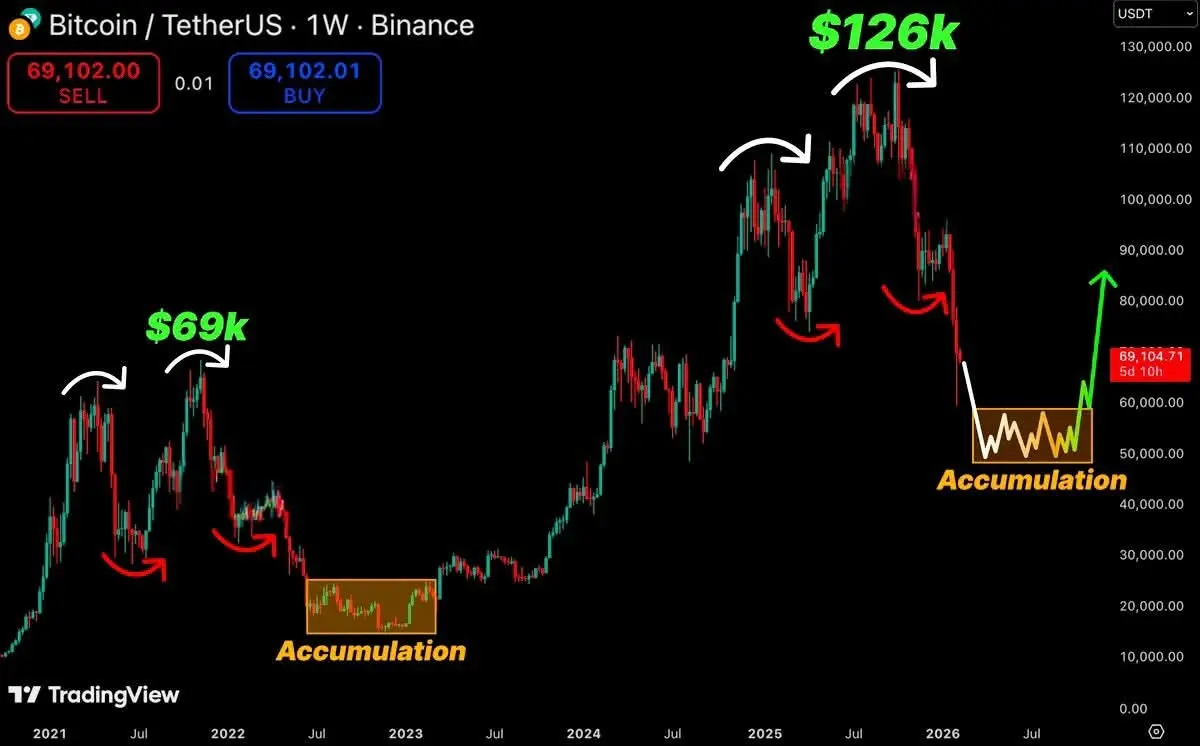
Watching Closely 🔍️ALERT: IS BITCOIN REPEATING THE 2021 CYCLE?
Take A Close Look At This $BTC Structure.
History Doesn’t Repeat Exactly —
But It Often Rhymes.
Let’s Break It Down Clearly 👇
LAST CYCLE (2021–2022)
• Bitcoin Topped Near 69,000
• Distribution Formed At The High
• Lower High Structure Confirmed Weakness
• Sharp Breakdown Followed
• Price Entered A Long Accumulation Phase
That Accumulation Zone Lasted Months
Before The Next Expansion Phase Began.
NOW LOOK AT THE CURRENT STRUCTURE
• Recent Top Formed Near 126,000
• Clear Lower High Formation After The Peak
• Momentum Shifted Bearish
• Strong Sell Pres
BTC-2,13%
- Reward
- like
- Comment
- Repost
- Share
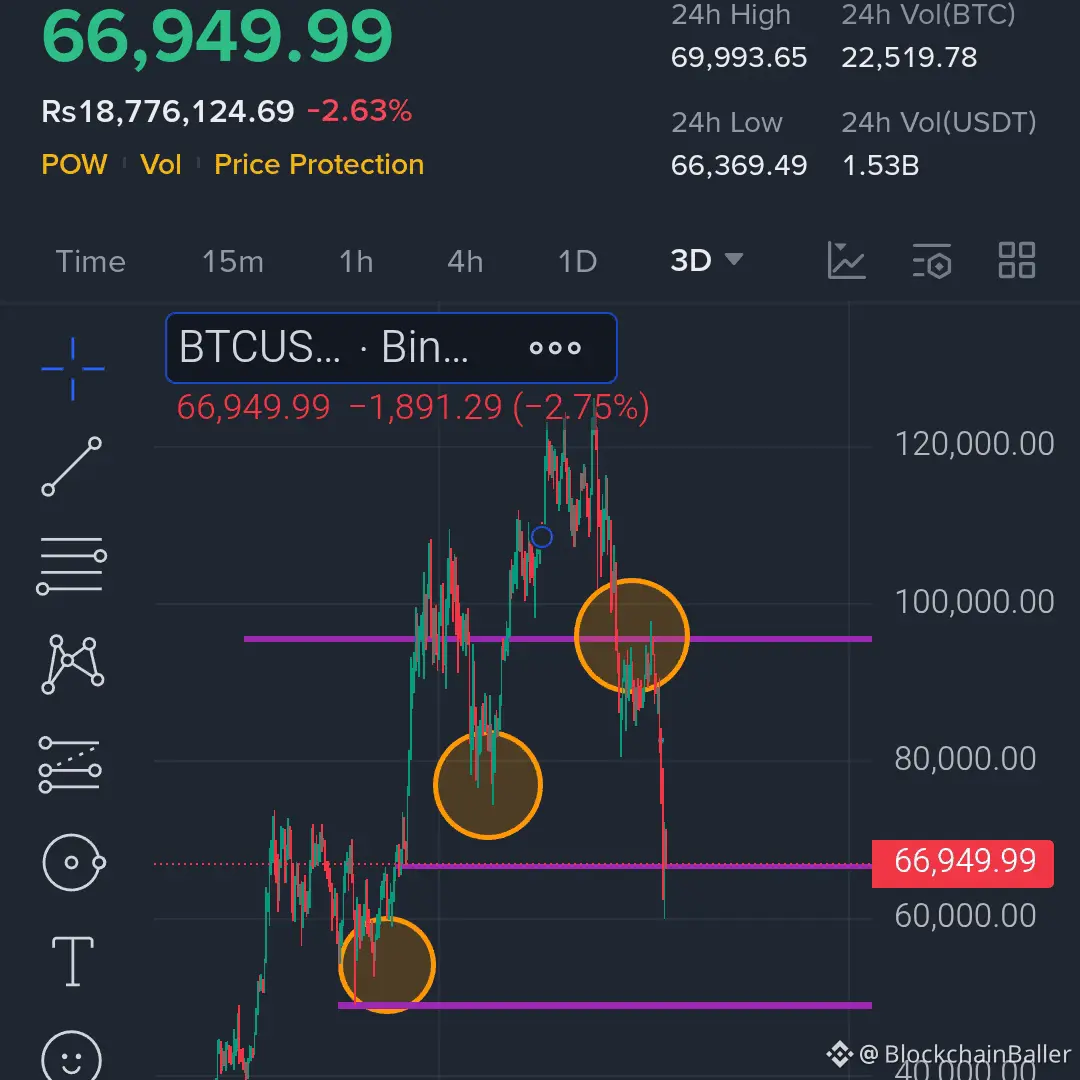
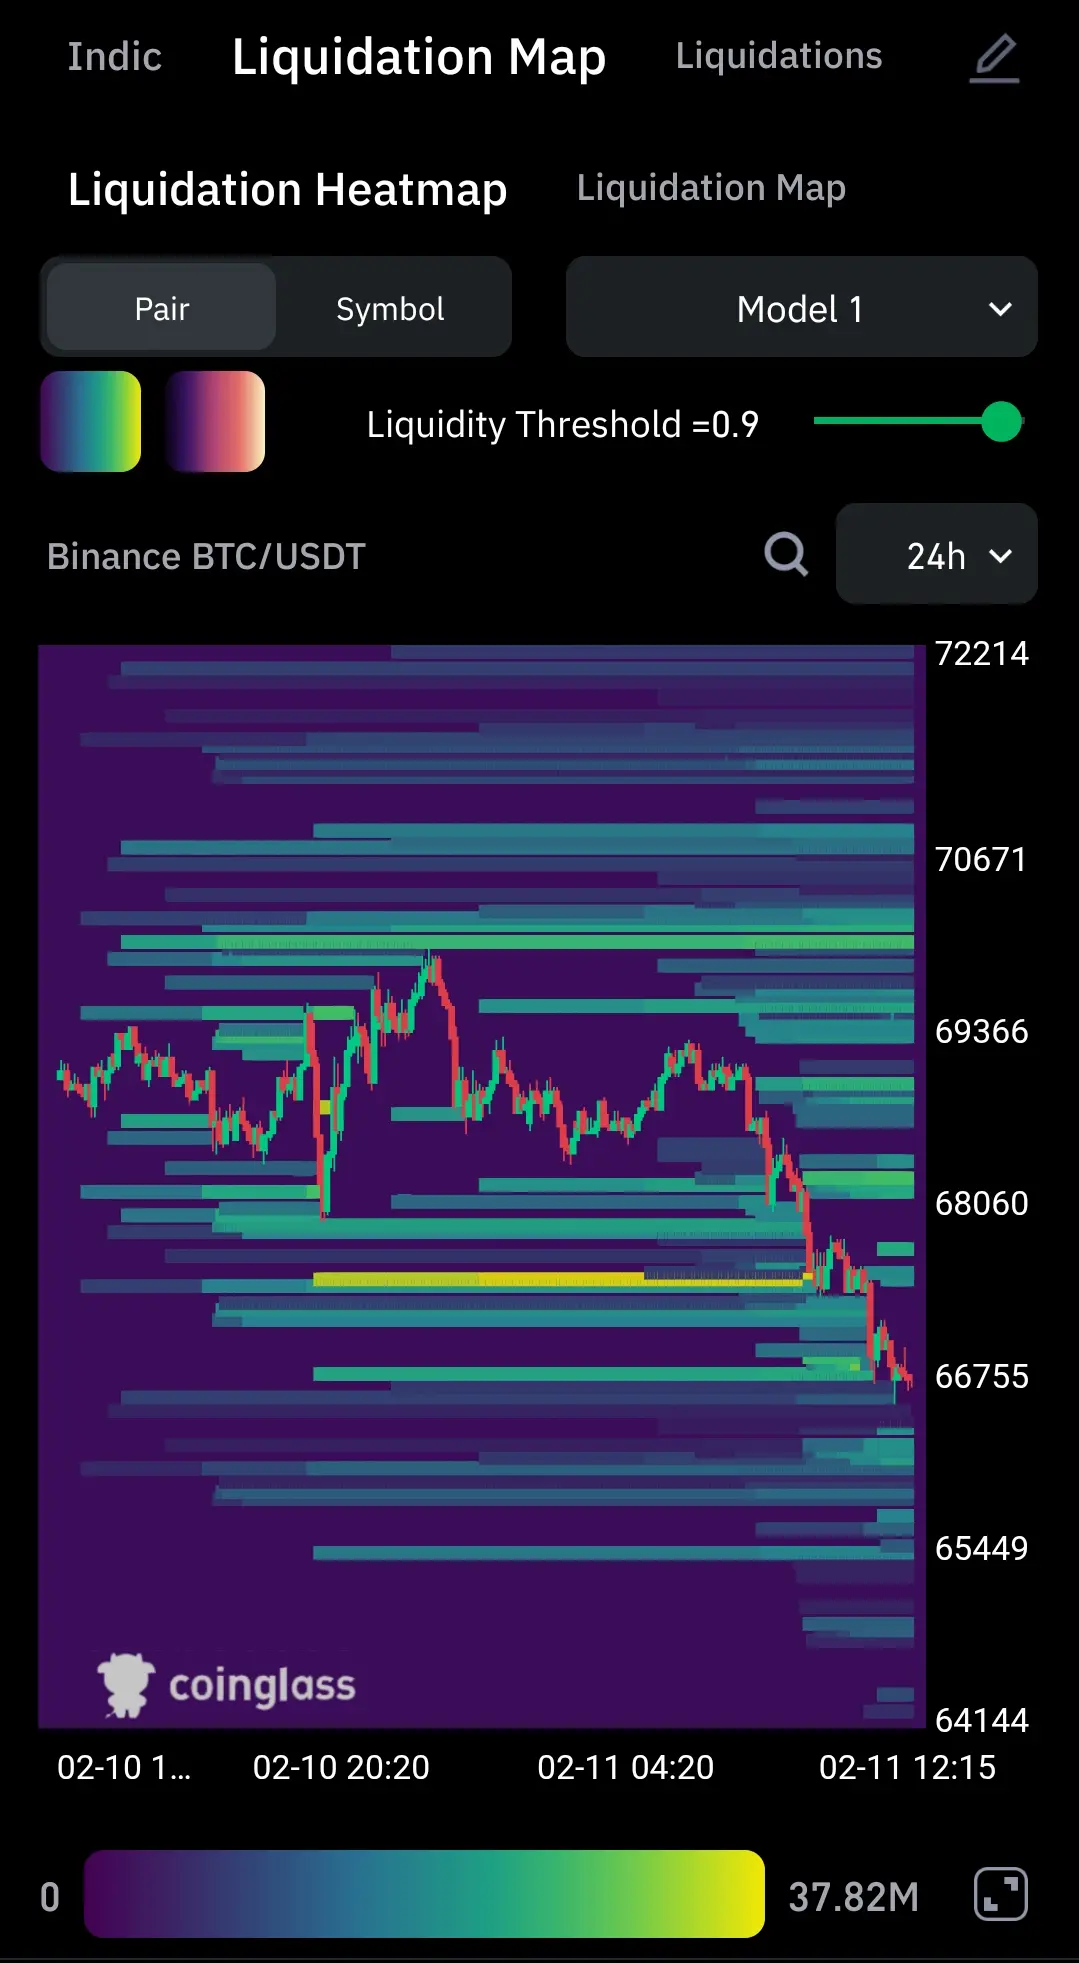
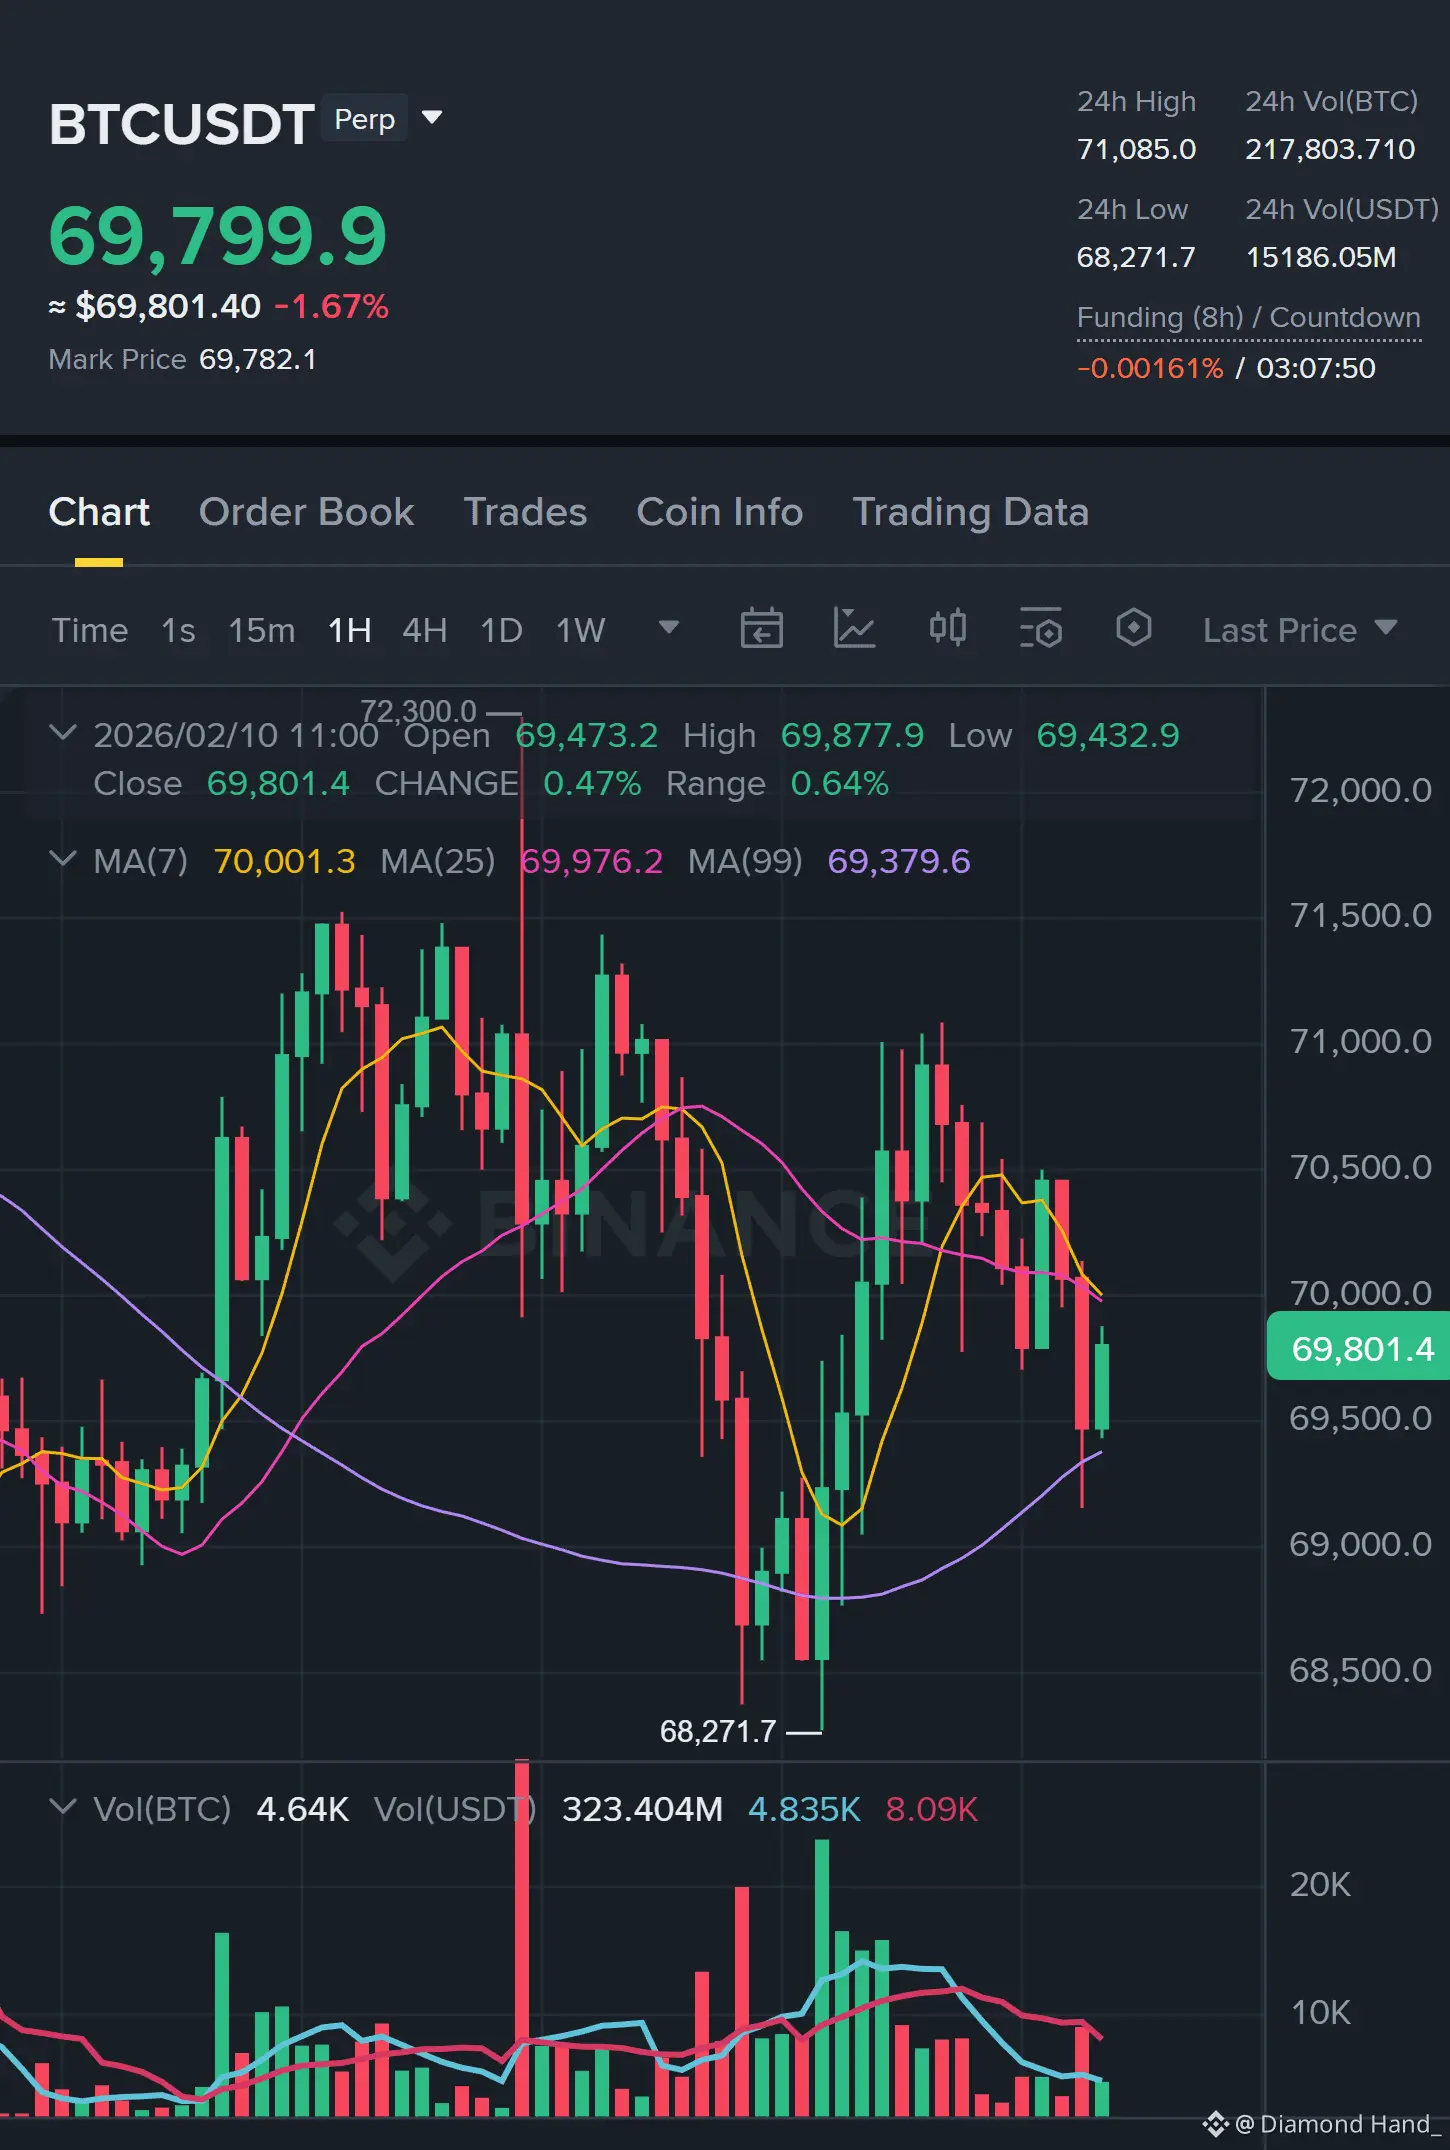
BTC/USDT just flushed hard into the $66.7k area, sweeping a big pocket of long liquidations (bright liquidity band below). Most downside liquidity looks largely cleared, while there’s still stacked liquidity overhead around $69k–$70k.
Short-term vibe: after this liquidation run, price may pause or bounce, but any move up likely faces resistance where those upper liquidity bands sit.$BTC
Short-term vibe: after this liquidation run, price may pause or bounce, but any move up likely faces resistance where those upper liquidity bands sit.$BTC
BTC-2,13%
- Reward
- like
- 1
- Repost
- Share
GateUser-190093e6 :
:
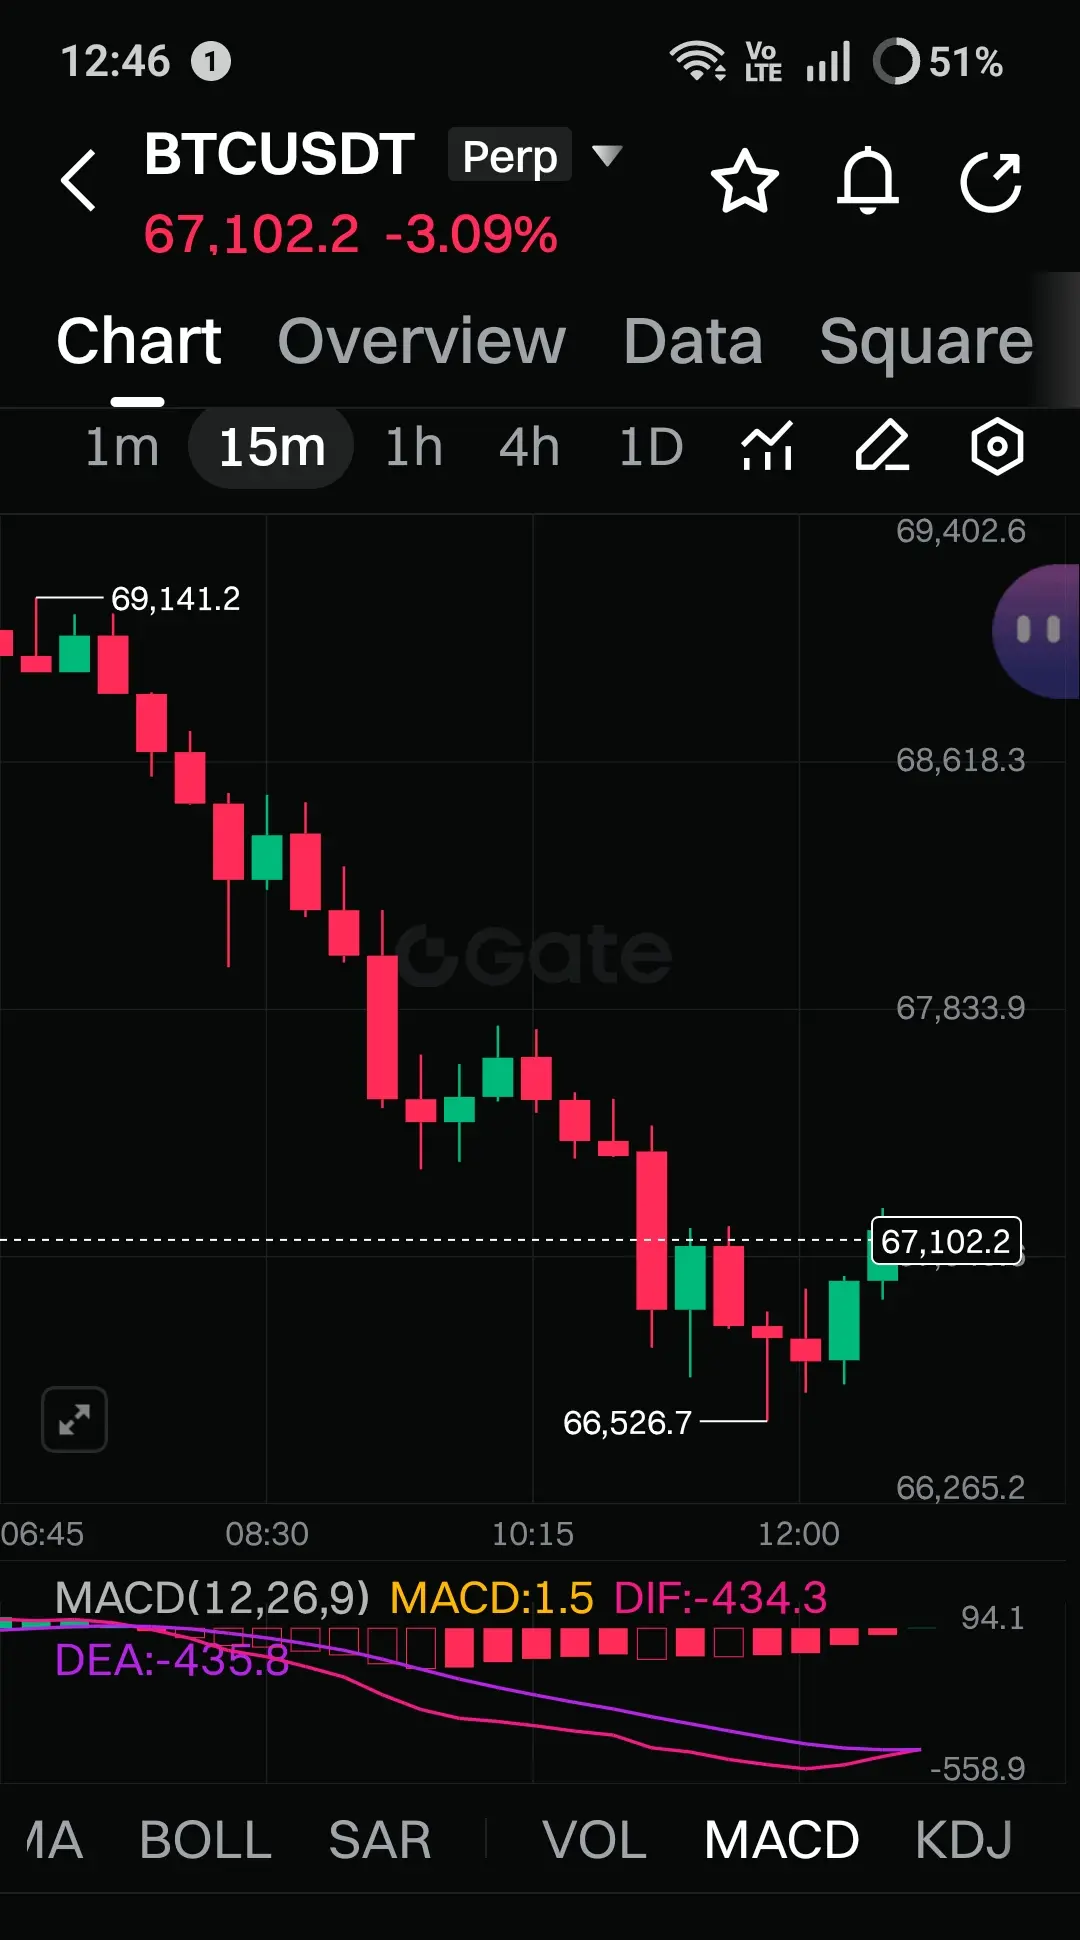
Buy long or sell short?I have analyzed $ETH in detail now ... According to my analysis ....
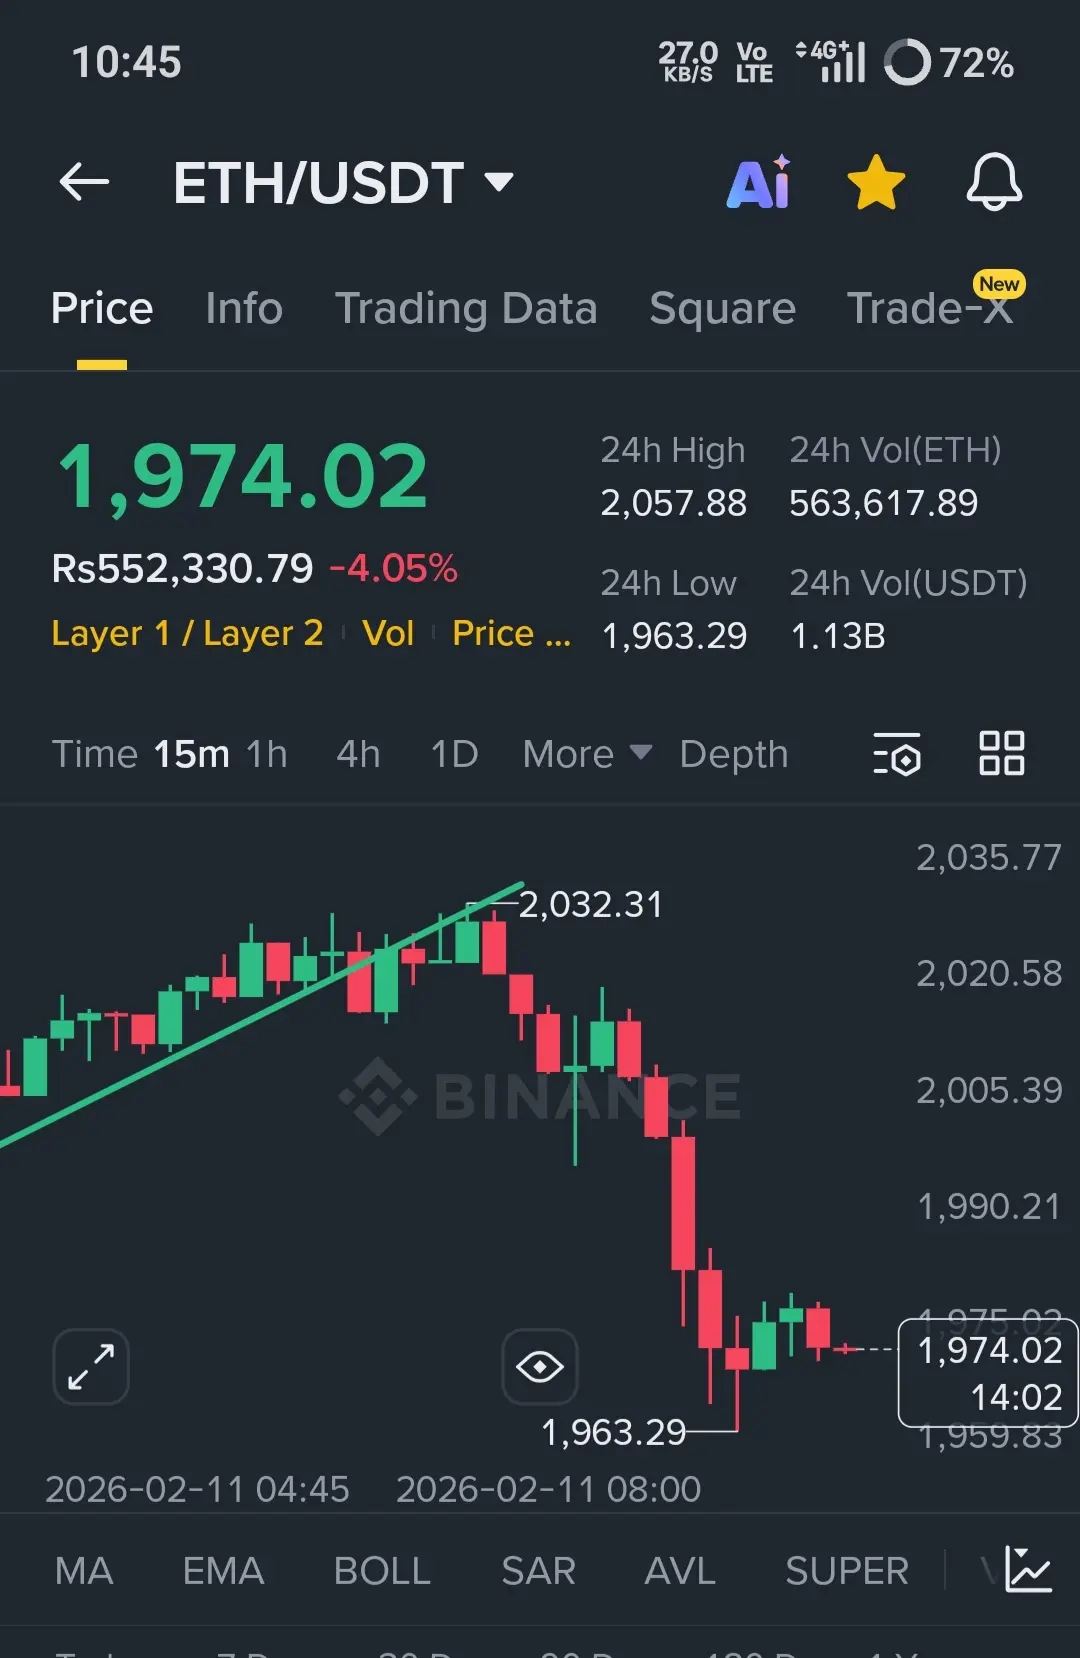
$ETH just had a sharp sell-off and is now trying to stabilize around the $1,970–$1,980 zone, which is acting as short-term support after that long wick. If this level fails, the next downside support sits near $1,950–$1,960.
On the upside, price is capped by $2,000–$2,015 as the first resistance, with stronger supply around $2,040–$2,060. For now, ETH looks stuck in a recovery attempt after heavy pressure — watch whether buyers can defend current support or if another leg down opens up. $ETH
ETH-3,45%
- Reward
- like
- Comment
- Repost
- Share
- Reward
- 1
- 3
- Repost
- Share
Go,LongLive! :
:
GT is GTView More
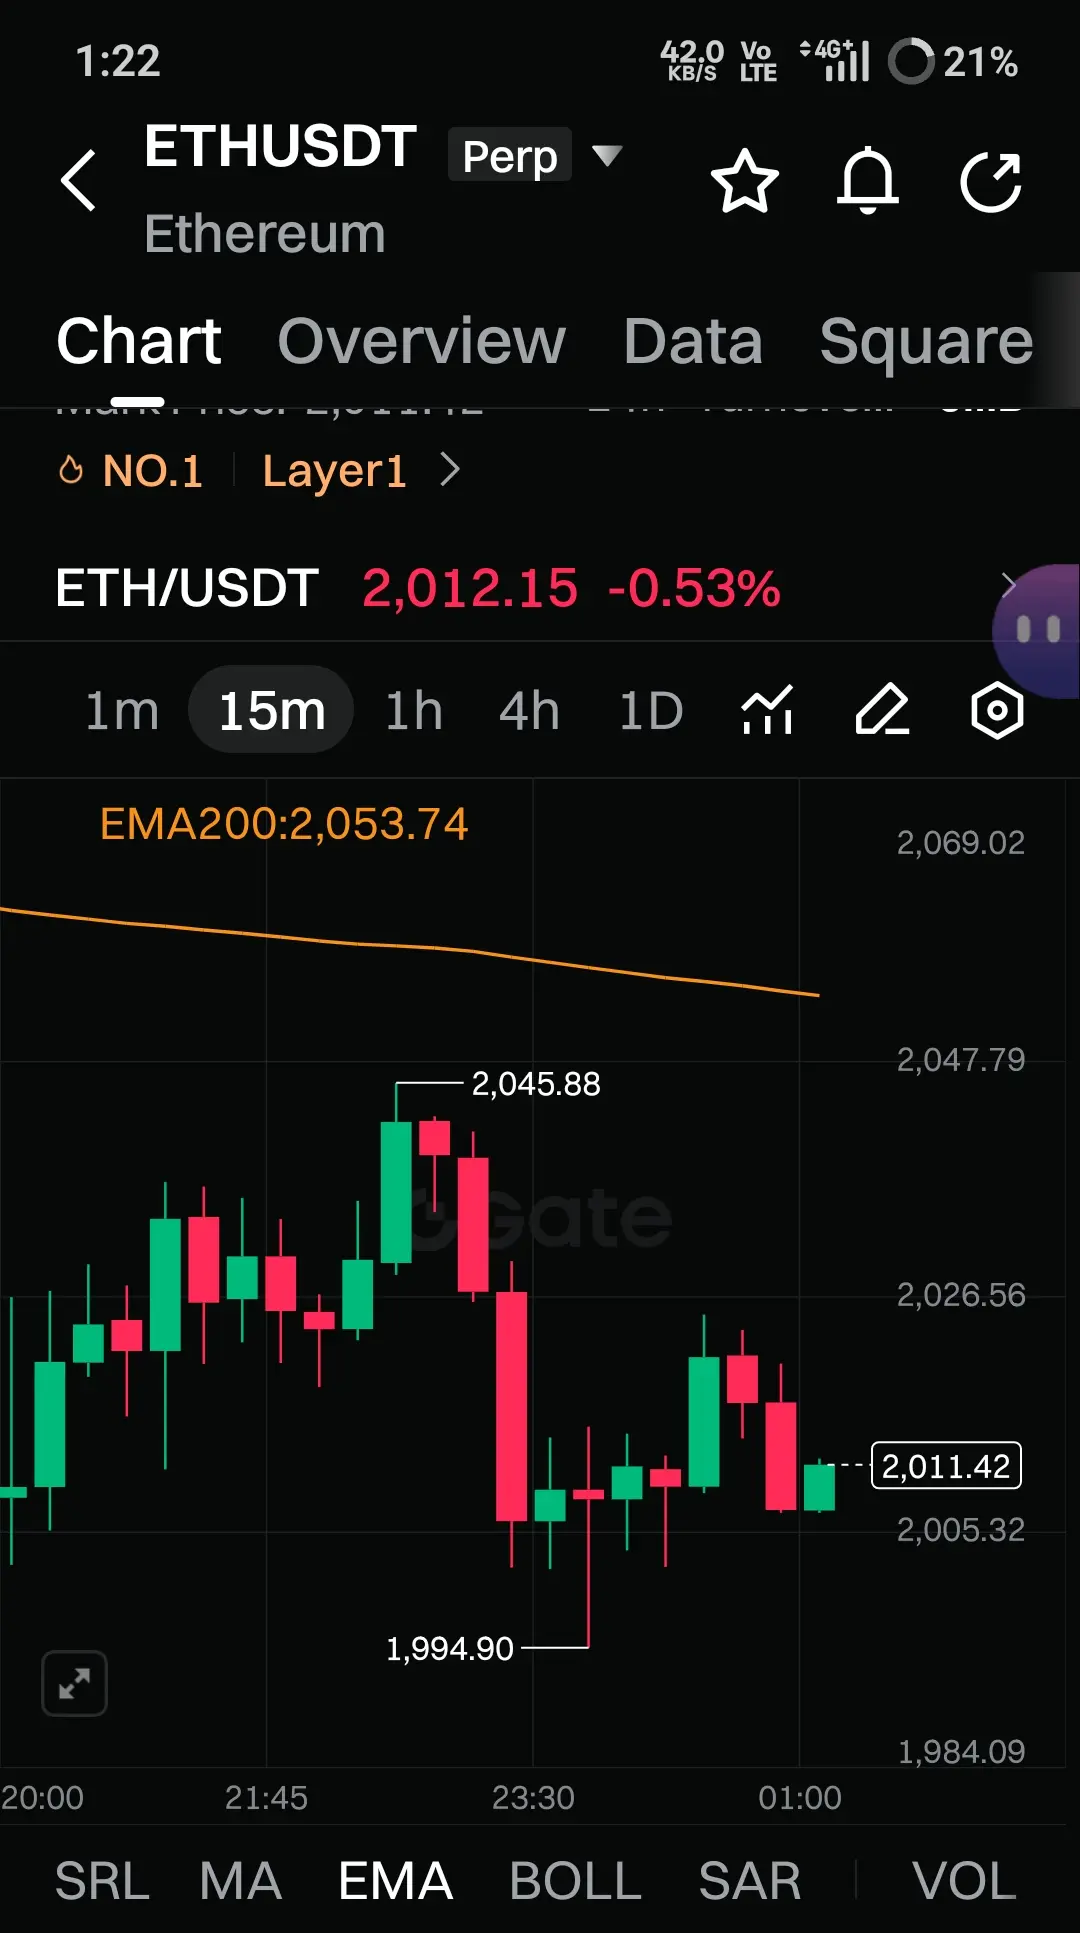
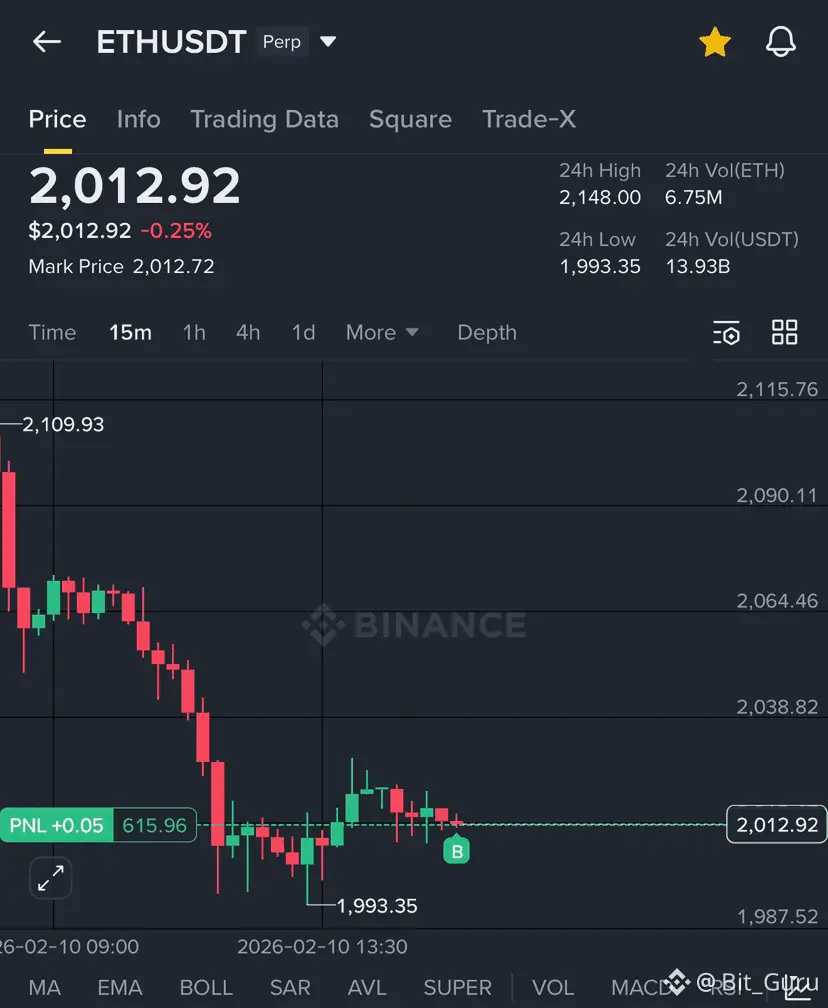
$ETH is Still bearish from that But I am Long from here with the reason of bullish volume taken in…
This will give me good profit. I will hold this one to get maximum with this trade.
If you want to take trades with me or want to copy me this is free for you. Take a Long trade on it and make profit.$ETH
This will give me good profit. I will hold this one to get maximum with this trade.
If you want to take trades with me or want to copy me this is free for you. Take a Long trade on it and make profit.$ETH
ETH-3,45%
- Reward
- like
- 1
- Repost
- Share
Moood10207 :
:
The Bollinger Bands are gradually narrowing, preparing to choose a direction. Isn't it risky to enter the market impulsively now?
- Reward
- 2
- Comment
- Repost
- Share
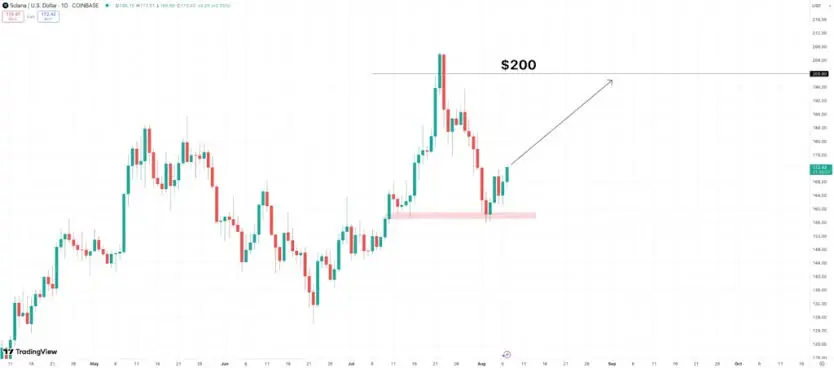
#Solana ($SOL ) is once again back in the spotlight as price action shows a strong recovery from recent pullbacks. After a sharp impulsive move followed by a healthy correction, SOL is now attempting to reclaim higher levels — and the big question traders are asking is whether the $200 mark is achievable in the coming month.
From a technical perspective, Solana’s structure remains constructive. Price respected a clear demand zone after the recent retracement, suggesting that buyers are actively defending this area. The bounce from this support aligns with a higher-low formation, which is a cla
From a technical perspective, Solana’s structure remains constructive. Price respected a clear demand zone after the recent retracement, suggesting that buyers are actively defending this area. The bounce from this support aligns with a higher-low formation, which is a cla
SOL-3,98%
- Reward
- like
- Comment
- Repost
- Share
$BTC is coiling like a spring — one clean push and it runs the board.
$BTC - LONG
Trade Plan:
Entry: 69621.442 – 69999.958
SL: 68675.149
TP1: 70946.251
TP2: 71324.767
TP3: 72081.801
Why this setup?
4h structure is at a decision point inside (69621.442-69999.958).
I want a hold and follow-through — that’s the confirmation.
Once confirmed, TP1 at 70946.251 is the first level to test. Lower TF RSI shows no extreme overbought, leaving room for continuation.
If price accepts beyond 71603.154, the bias flips and the trade is invalid.
Debate:
Is this move about to roll over to 70946.251, or does it
BTC-2,13%
- Reward
- 1
- Comment
- Repost
- Share
Currently, the price of $XRP is hovering around $1.44–$1.45. Although there has not been much movement in the last 24 hours, a slight green signal has been seen. However, the reality is that there has been a correction of about 12% on the weekly chart, which is part of the pressure on the entire market. XRP’s market cap is still around $88 billion, and the 24-hour trading volume is over $3.8 billion—which indicates strong interest. $XRP
Ripple’s institutional adoption, banking partnerships, and ETF inflow are big pluses in the long term. Therefore, many are seeing this correction as an opp
Ripple’s institutional adoption, banking partnerships, and ETF inflow are big pluses in the long term. Therefore, many are seeing this correction as an opp
XRP-1,71%
- Reward
- 1
- 1
- Repost
- Share
Dannyw:
Ethereum's current high is $2151. According to this plan, the watershed level, which is 0.382, the entry point for a long position is in the range of 1995 to 2000. The approach is consistent with Bitcoin: if a large bearish candle breaks below 1990, manually exit long positions. Don't force it; continue to wait for the next entry price: 1828. With the support at the 1750 daily level, the main trend remains bullish. As before, we consider all possible scenarios of the price movement. No matter how the market moves, we stay confident and prepared. Strategic planning is what the market makers fear most. When Ethereum approaches 1995 to go long, if the hourly chart rapidly breaks below, stick to the stance and wait for the 1828 level.Elevate Your Trading with Gate.io
Gate.io is more than just an exchange; it's a comprehensive ecosystem designed to help you Master the Crypto Trade. With a massive selection of altcoins and advanced trading tools, you have everything you need to navigate the markets with confidence.
Why Choose Gate.io?
Massive Variety: Access hundreds of leading and emerging cryptocurrencies.
Advanced Security: Trade with peace of mind knowing your assets are protected by industry-leading security protocols.
Powerful Features: From spot trading to futures and staking, find the tools that match your strat

- Reward
- 1
- Comment
- Repost
- Share
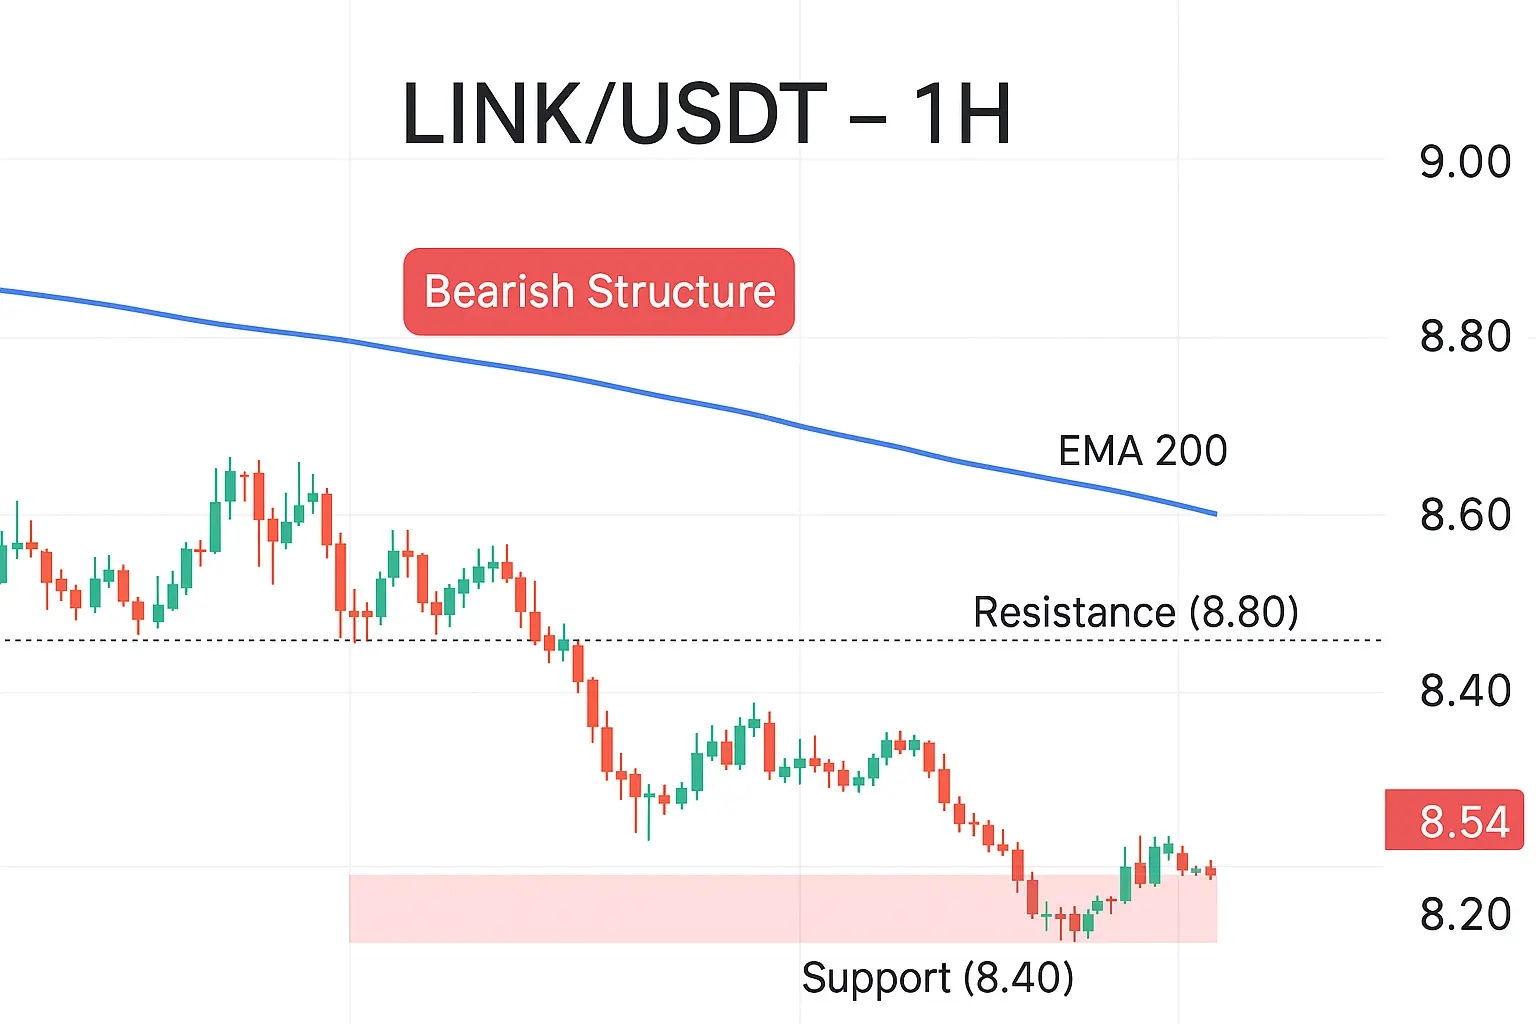
$LINK /USDT – Market Update 🔵
$LINK previously moved downward, but price is now attempting a slow recovery with small green candles. Momentum is still weak, however buyers are gradually stepping in.
A sustained move above resistance is needed for stronger upside confirmation. Until then, price may continue slow and cautious movement.
Current Price: 8.54
Support: 8.40 – 8.25
Resistance: 8.70 – 8.90
TP1: 8.70
TP2: 8.90
SL: 8.18
Holding above 8.40 can support further recovery, while a break below may bring renewed selling pressure.
Trade $LINK here 👇👇👇
$LINK
LINK-2,38%
- Reward
- 1
- Comment
- Repost
- Share
Fed's $8.3B Injection Incoming as S&P 500 Charges Toward 7,000 Milestone
Feb, 9, 2026 2 min read by Coinpaper
The Federal Reserve is set to unleash an $8.3B liquidity injection into financial markets tomorrow at 9:00 a.m. ET, the largest single operation within a broader $53.5B short-term support program.
Traders are already framing the move as a stress test of market plumbing rather than a classic "money-printing" pivot, but in today's hyper-levered environment, even technical flows can move narratives fast.
What the Fed Is Actually Doing
The operation will be conducted via short-term repo or
BTC-2,13%
- Reward
- 1
- Comment
- Repost
- Share
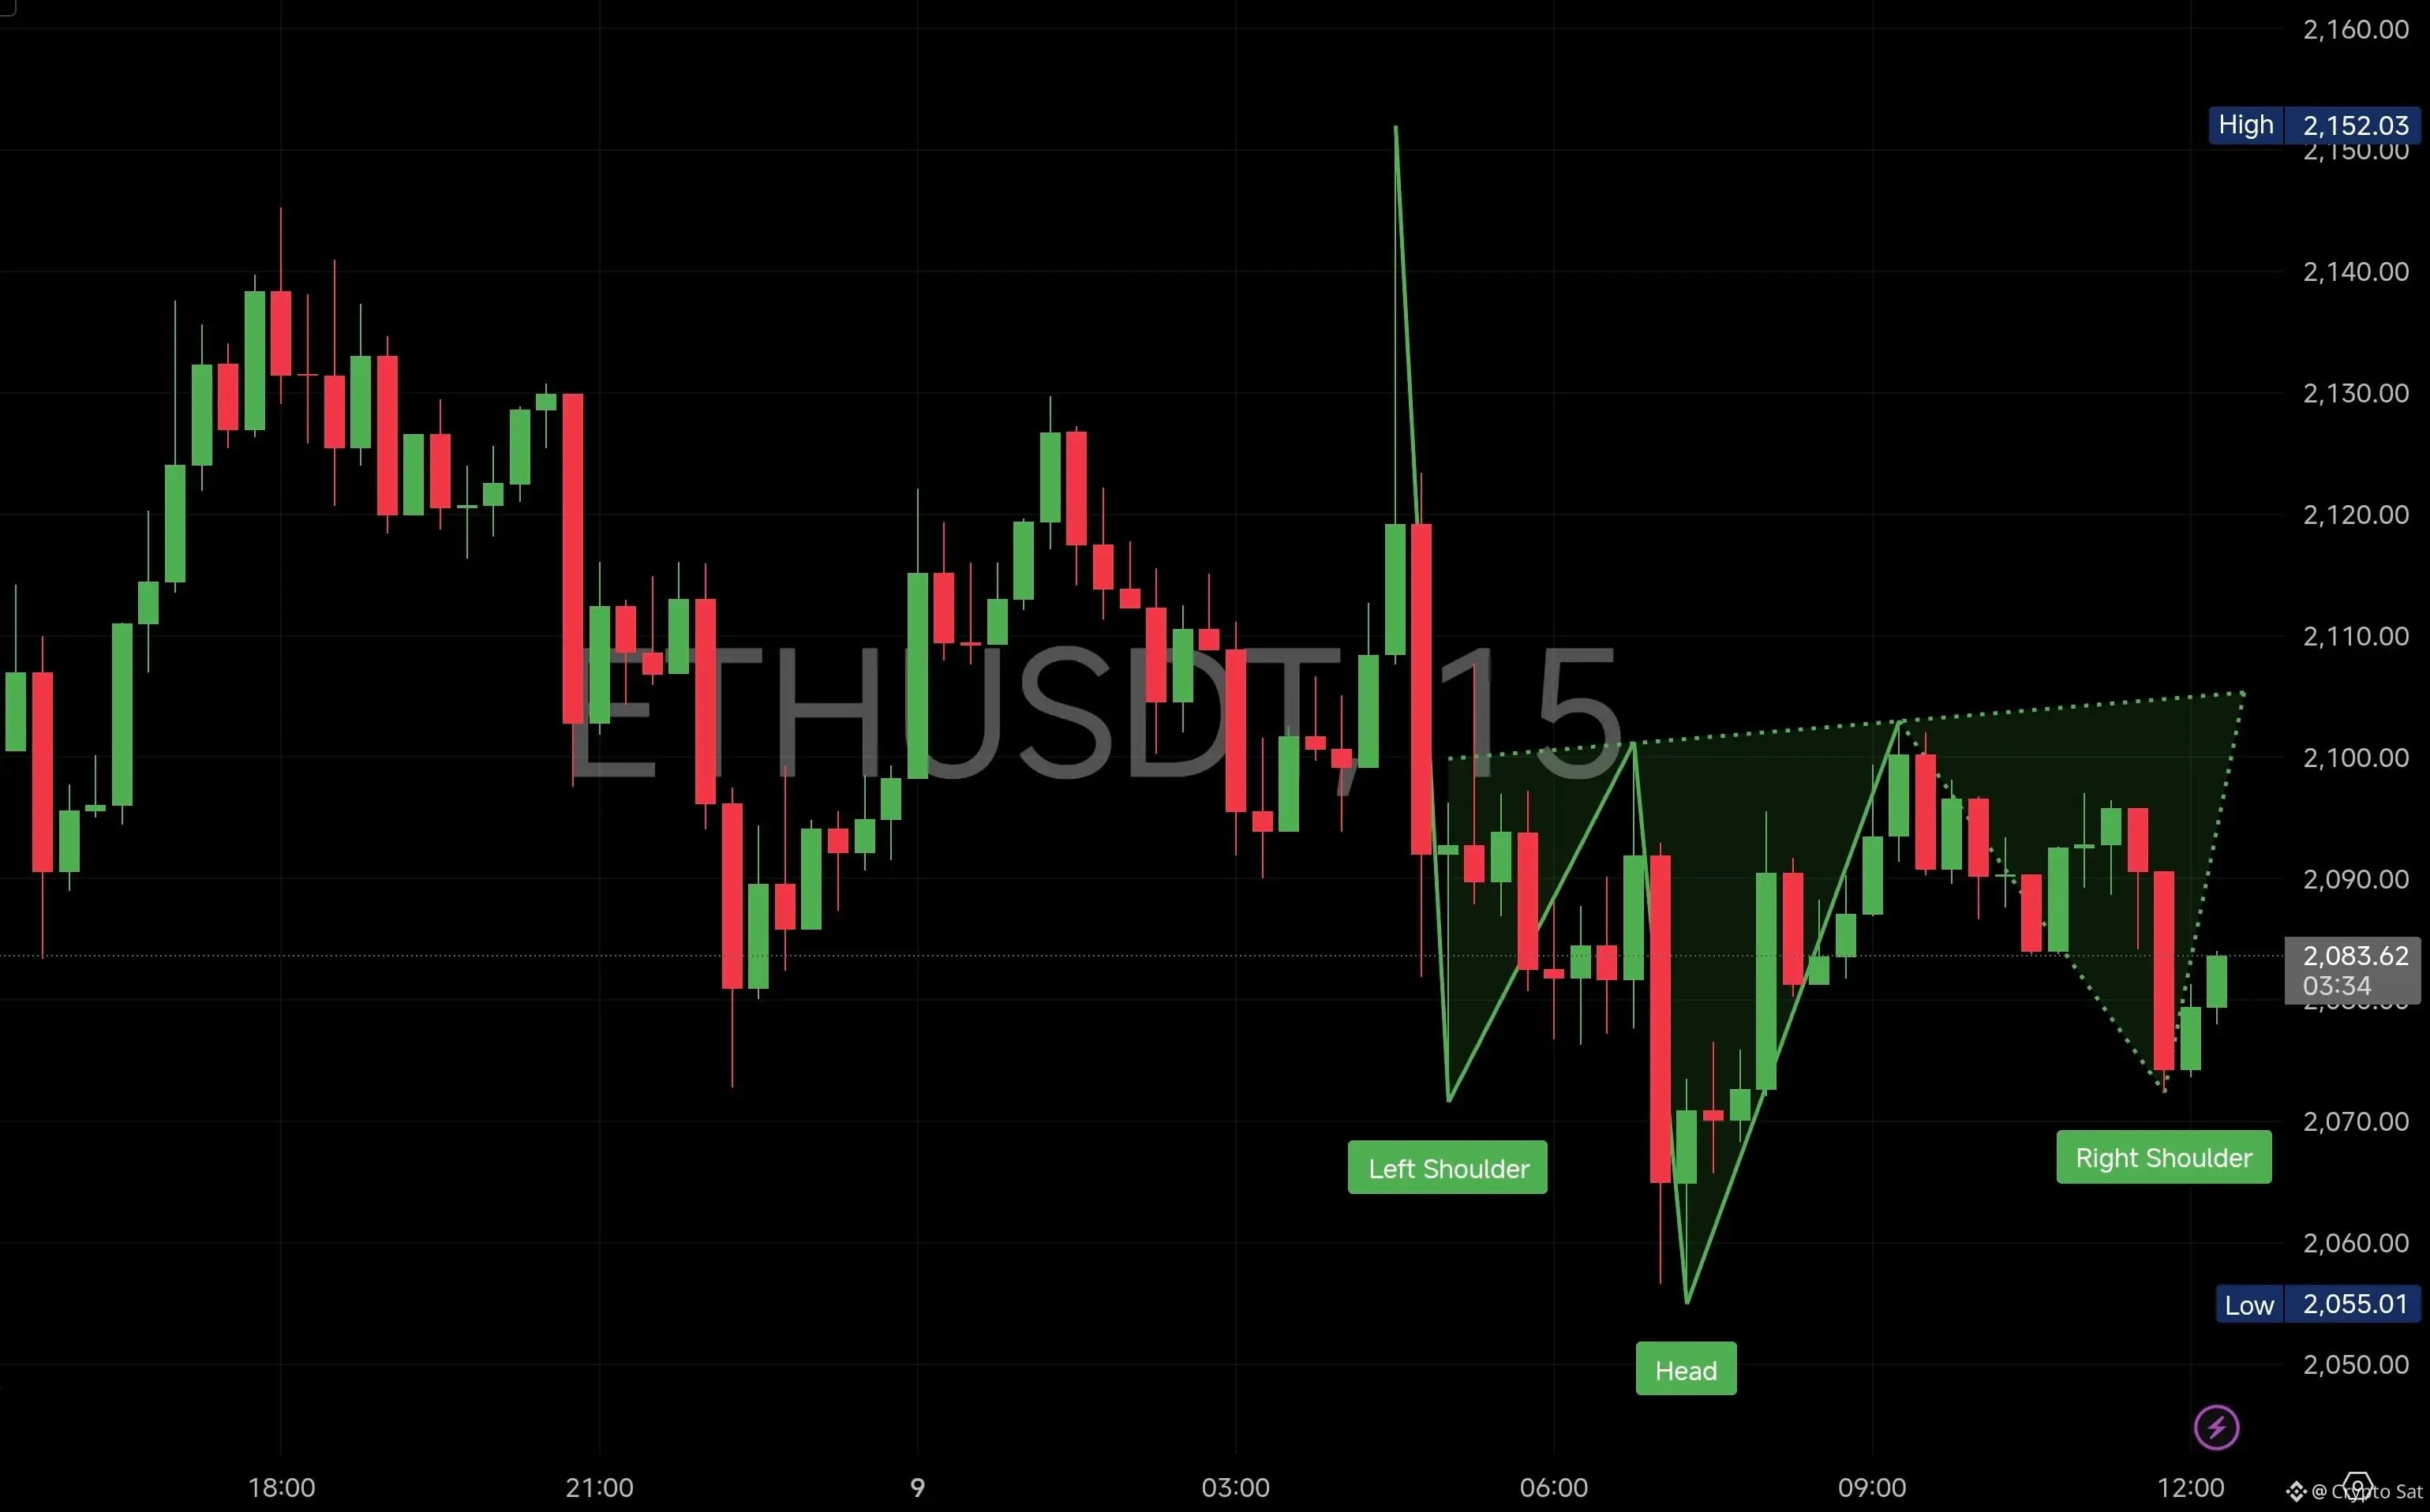
$ETH is printing a clear inverted Head & Shoulders structure on the 15m chart. The left shoulder and head are already formed, and the right shoulder is developing near the same resistance band, showing sellers are still active on every push higher. This is not panic selling — it’s controlled distribution.
Price is currently hovering around 2080–2090, which is acting as a neckline reaction area. As long as #ETH stays below the dotted resistance path, upside remains capped and moves are likely to stay corrective.
If momentum weakens further and this structure plays out, downside continuation be
Price is currently hovering around 2080–2090, which is acting as a neckline reaction area. As long as #ETH stays below the dotted resistance path, upside remains capped and moves are likely to stay corrective.
If momentum weakens further and this structure plays out, downside continuation be
ETH-3,45%
- Reward
- 1
- Comment
- Repost
- Share
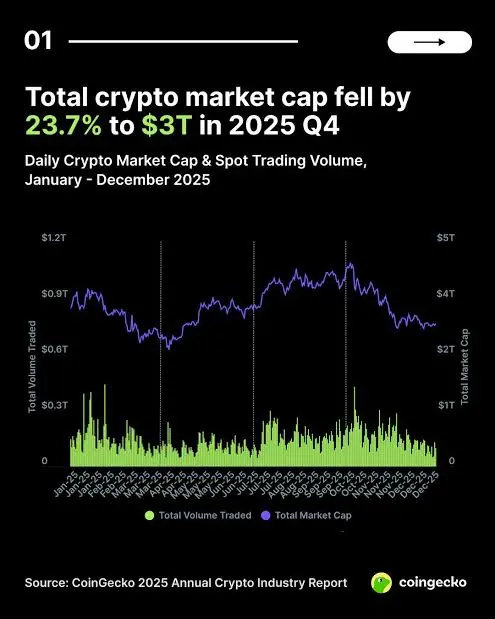
The crypto market faced a sharp correction in the final quarter of 2025, with total market capitalization plunging -23.7% to finish at $3.0 trillion. This marked a -10.4% Year-on-Year decline, crypto’s first annual downturn since 2022. While the quarter saw a brief all-time high of $4.4 trillion, a historic $19 billion liquidation event in October, sent prices slumping. Despite the price retreat, volatility pushed average daily trading volumes to a yearly high of $161.8 billion, while the stablecoin sector climbed +48.9% annually to hit a record $311.0 billion.
The year was characterized by a
The year was characterized by a
- Reward
- like
- Comment
- Repost
- Share
Trending Topics
View More240.68K Popularity
55.11K Popularity
28K Popularity
21.62K Popularity
19.14K Popularity
Pin