Did Cathie Wood's "Sell Gold, Buy Bitcoin" Call Move the Market — or Was Bitcoin Already Turning Lower?
Bitcoin (
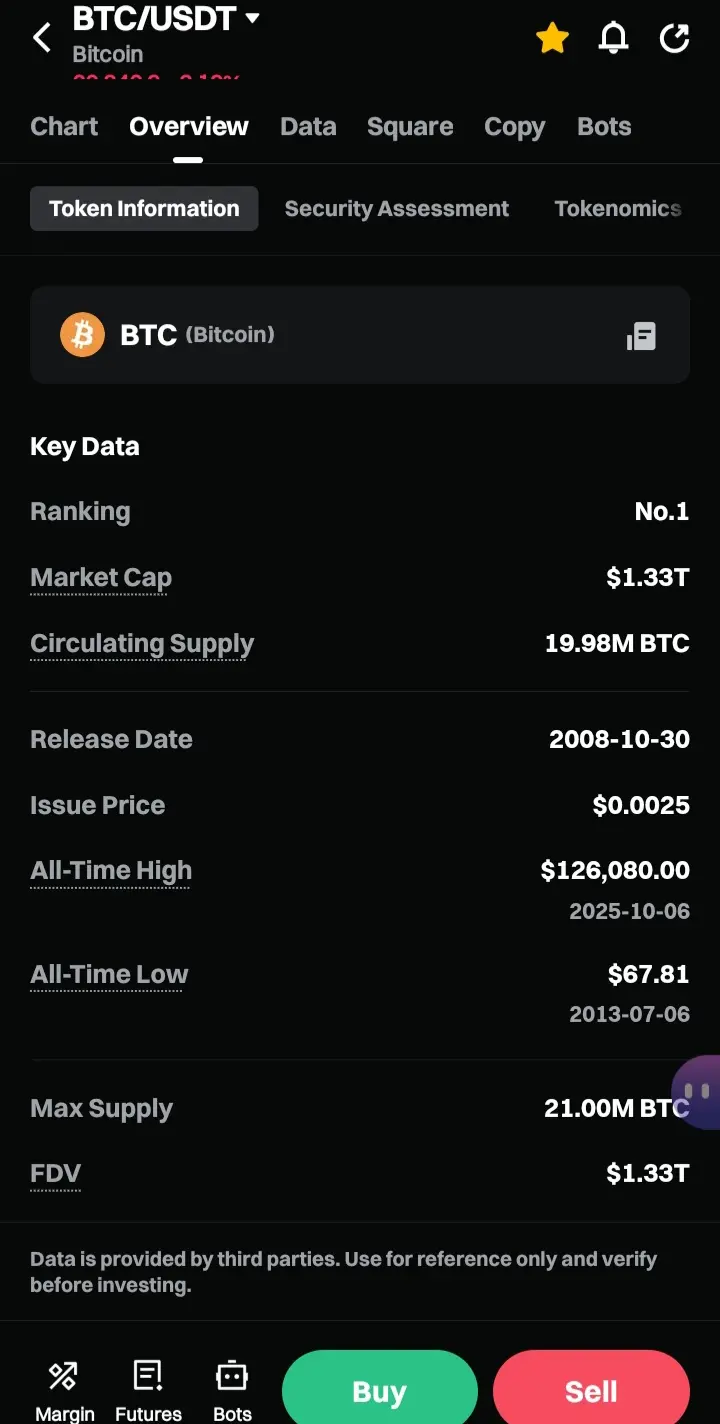
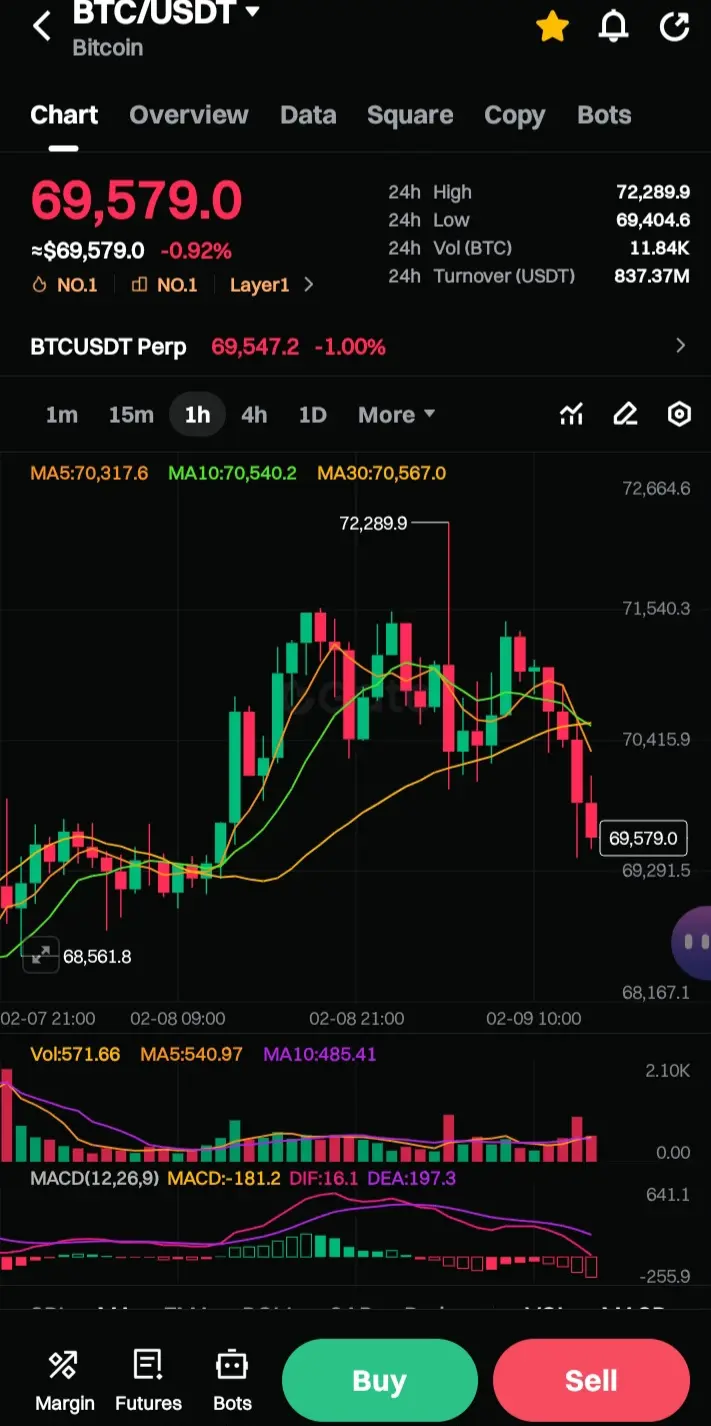
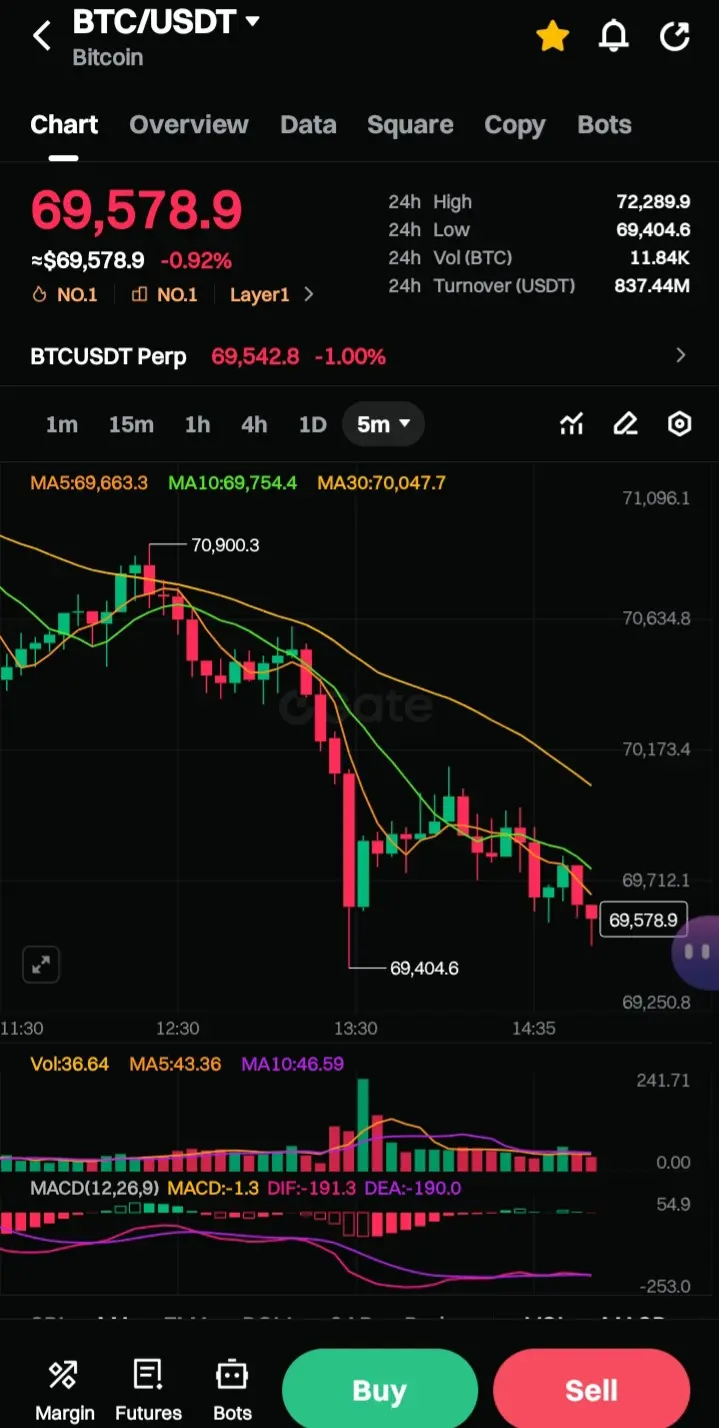
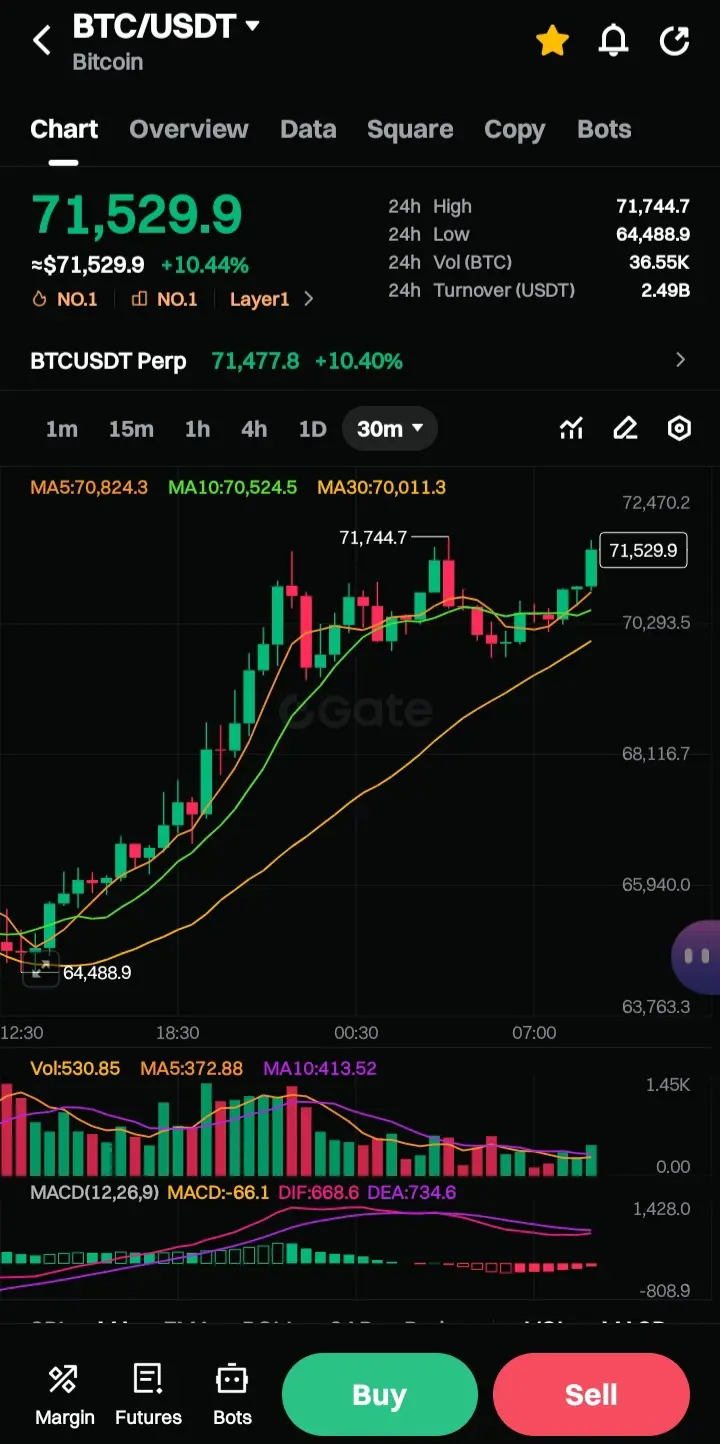
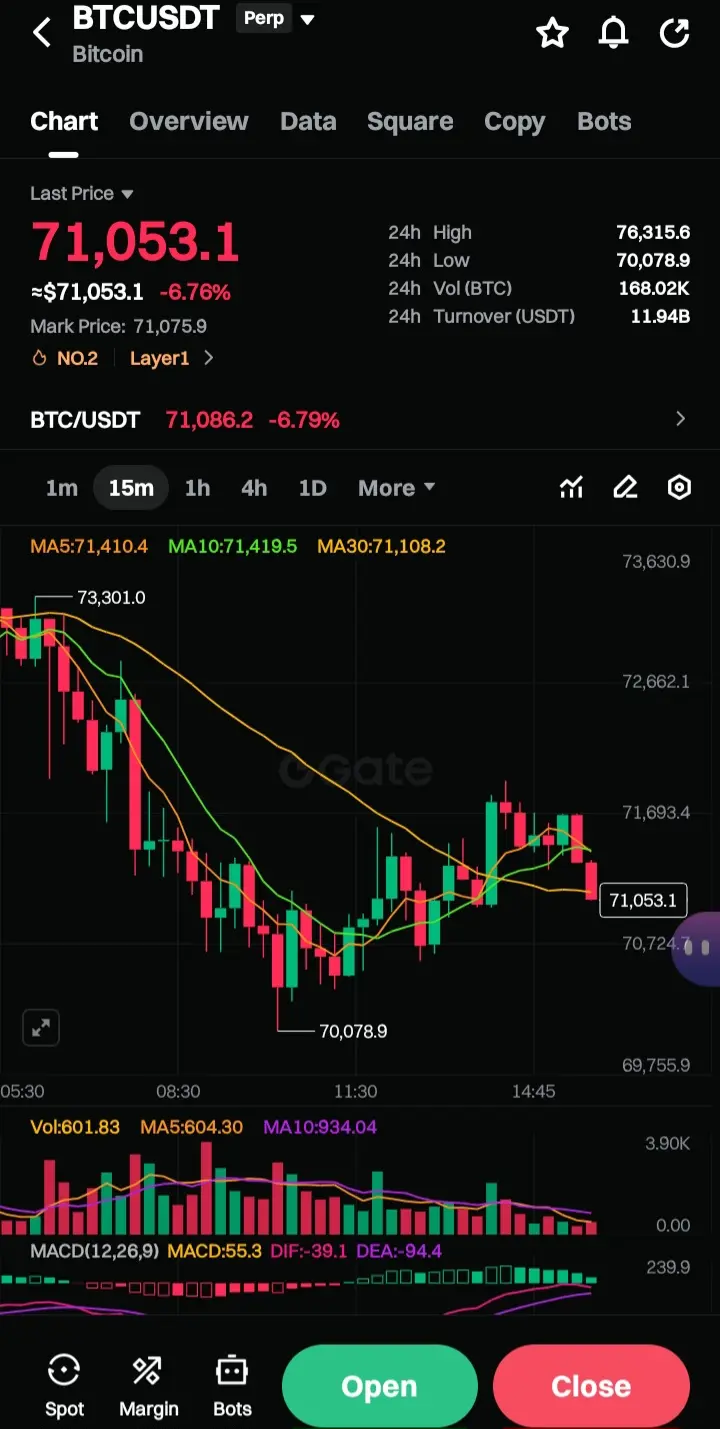
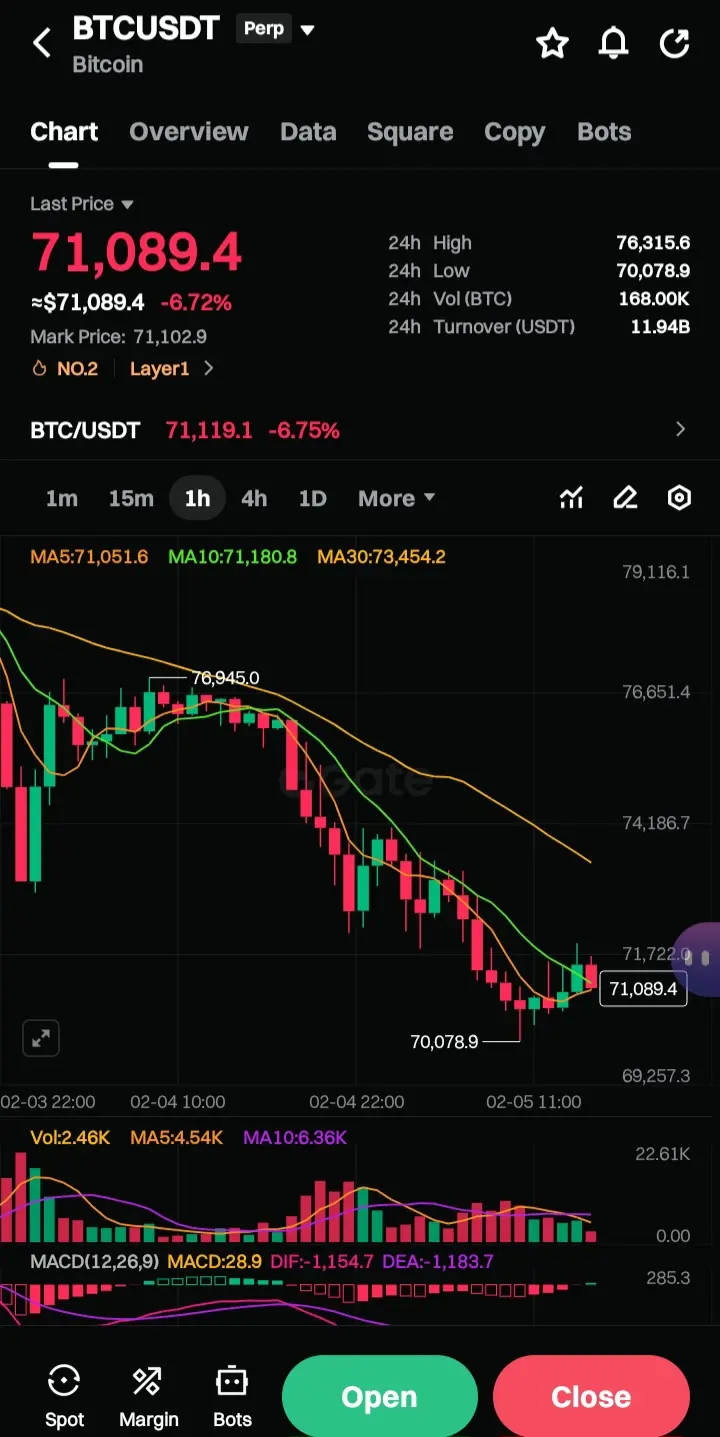
$BTC was trading around $76,475, down approximately 2.9% in the prior 24 hours, with a session low dipping to roughly $72,945.
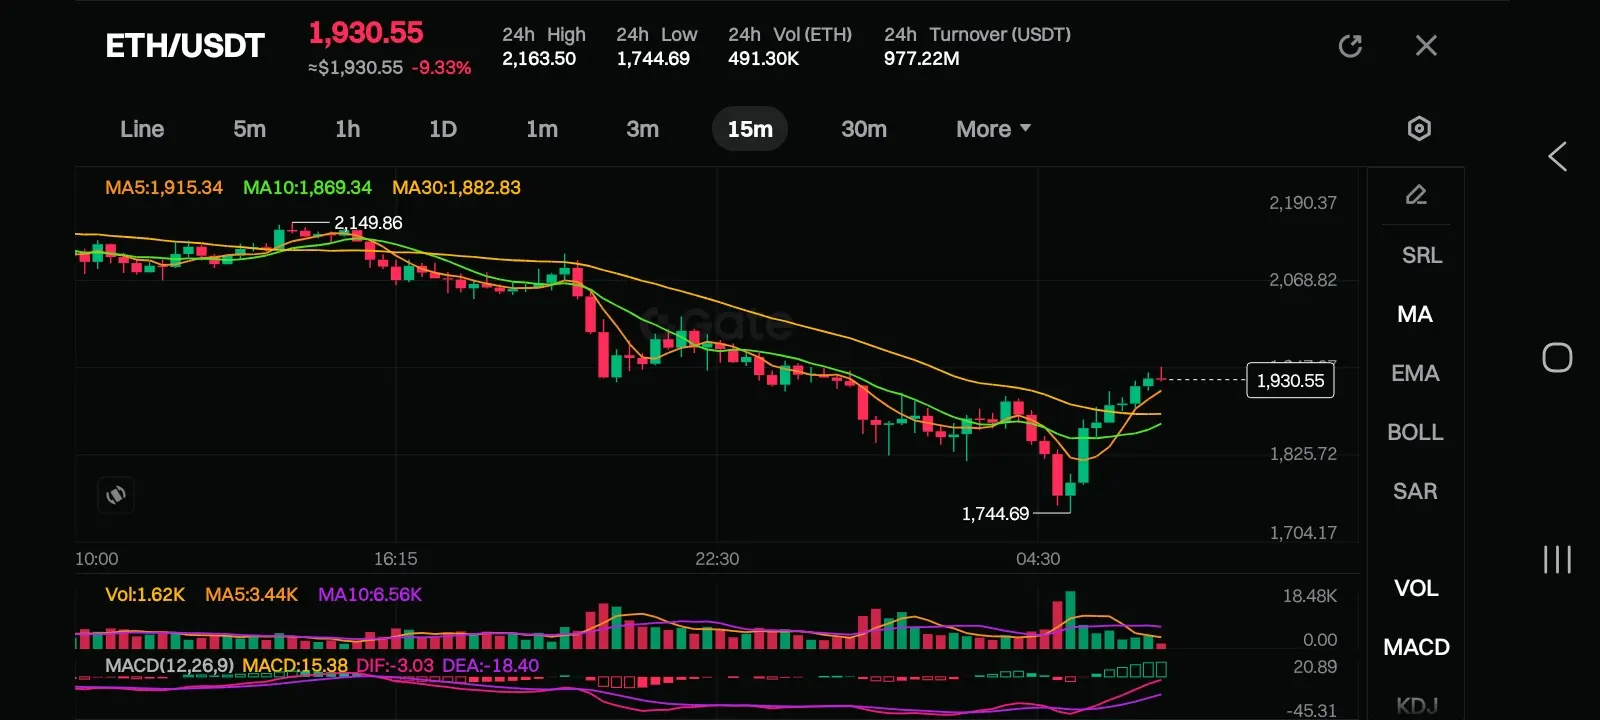
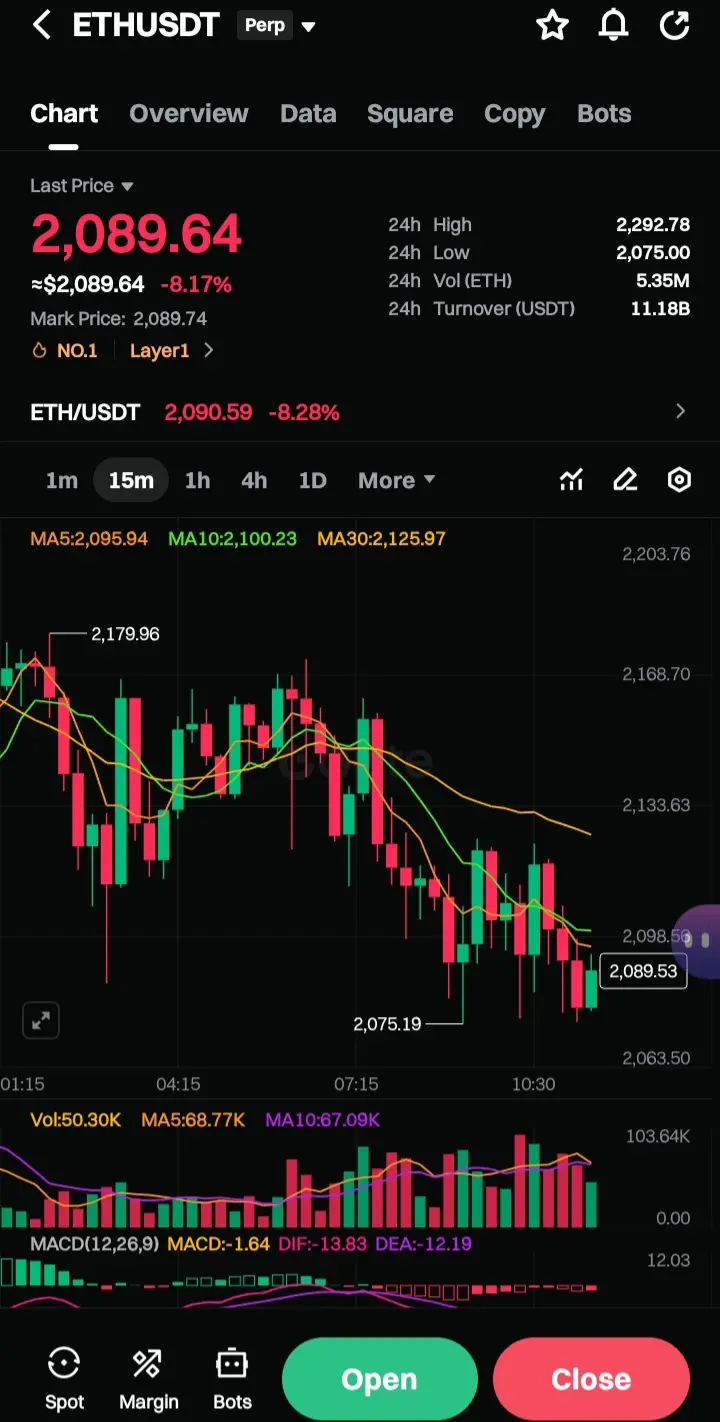
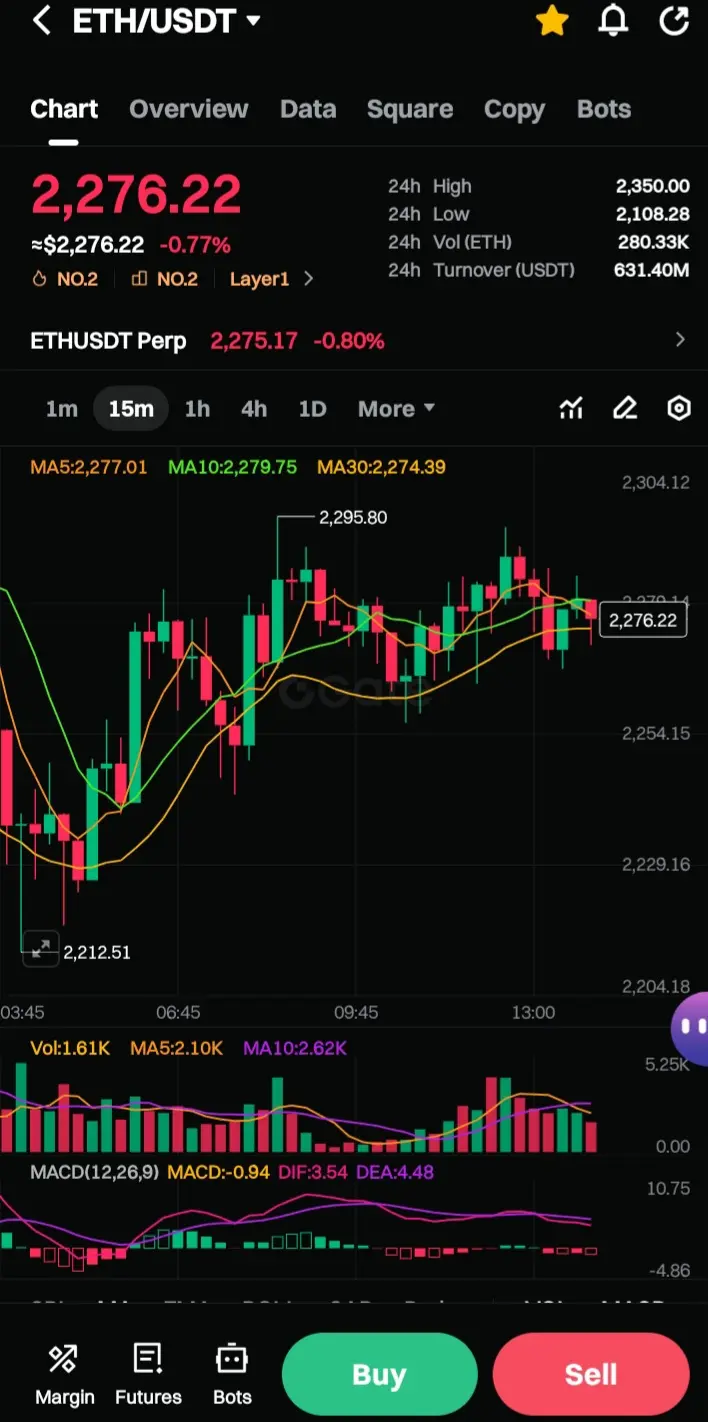
$ETH
#OvernightV-ShapedMoveinCrypto Ethereum followed a similar path, sliding to about $2,275 (-1.7%). Amid this pullback, headlines flashed across crypto news aggregators and exchange apps: “‘Sell Gold, Buy Bitcoin’: Cathie Wood Makes The Rotation Call.”
The phrase immediately sparked debate in trading chats and on social media: Did Cathie Wood’s high-profile statement trigger or accelerate the drop — or was the market already in the process of rolling over?
The Statement Itself
Cathie Wood, CEO of ARK Invest, made the comments in a recent interview/podcast appearance . She explicitly said she would “make a shift from gold into Bitcoin”, arguing that gold looked “extended” on a liquidity-adjusted basis (particularly when measured against M2 money supply).
Key points from her argument:
Gold’s supply grows ~1% annually (and miners can ramp production when prices rise).
Bitcoin’s supply growth is mathematically fixed at ~0.82% per year until the next halving, then drops to ~0.41%.
Gold’s recent parabolic move has pushed ratios (gold price vs. M2) to levels last seen in the late 1970s/early 1980s — a zone she views as signaling overvaluation or bubble-like conditions.
Bitcoin, despite underperforming gold in 2025, still offers superior long-term scarcity, adoption tailwinds (especially intergenerational wealth transfer), and very low correlation to gold (~0.14 since 2020).
Wood has consistently framed Bitcoin as a diversification asset that should deliver higher returns per unit of risk compared with traditional safe-havens. The “sell gold, buy Bitcoin” line was a concise, headline-friendly summary of that long-standing thesis.
Timing & Market Context
The timing is crucial for judging causality.
Gold had enjoyed a very strong run through much of 2025, significantly outperforming Bitcoin in percentage terms during parts of the year.
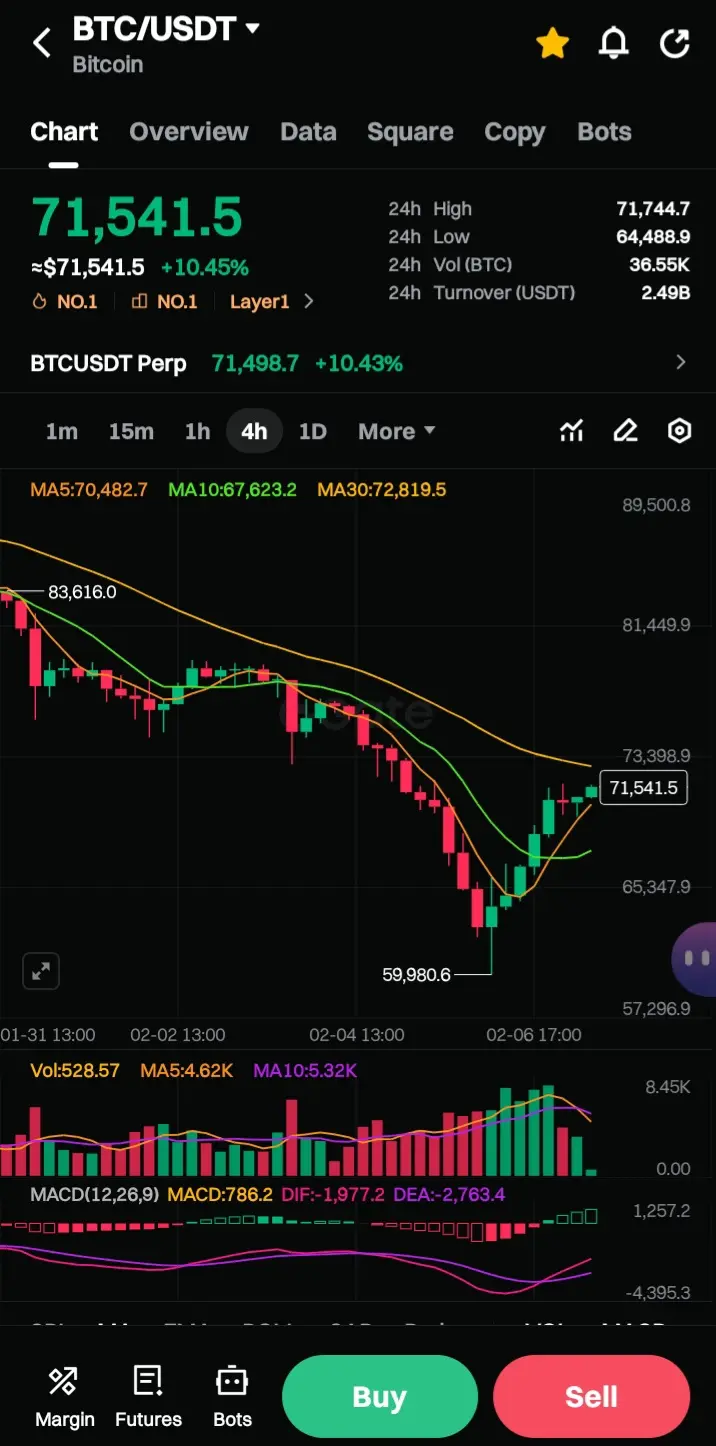
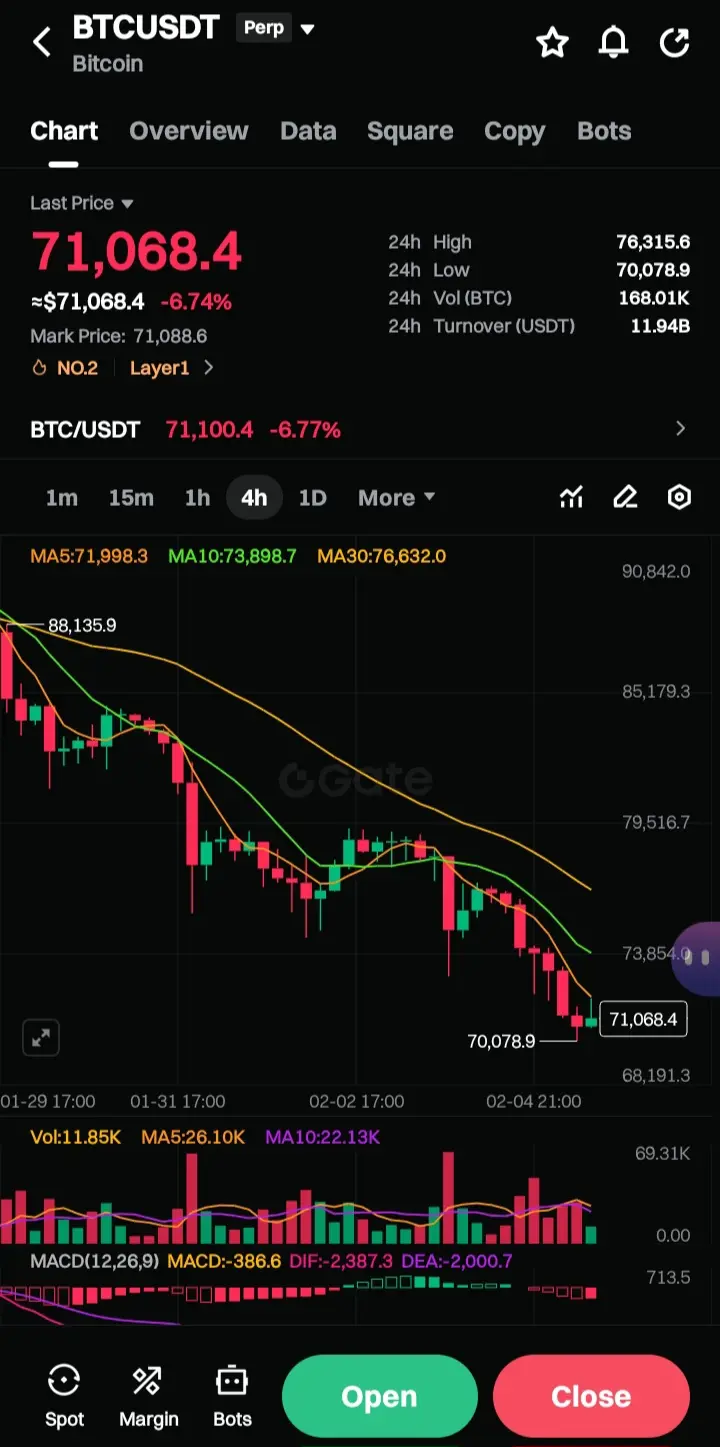
Bitcoin itself peaked well above $90,000–$97,000 in January 2026 before entering a multi-week correction.
By early February 2026, BTC had already given back a large portion of its post-2025 gains, trading down -14% over 7 days and -18.5% over 30 days (per exchange data).
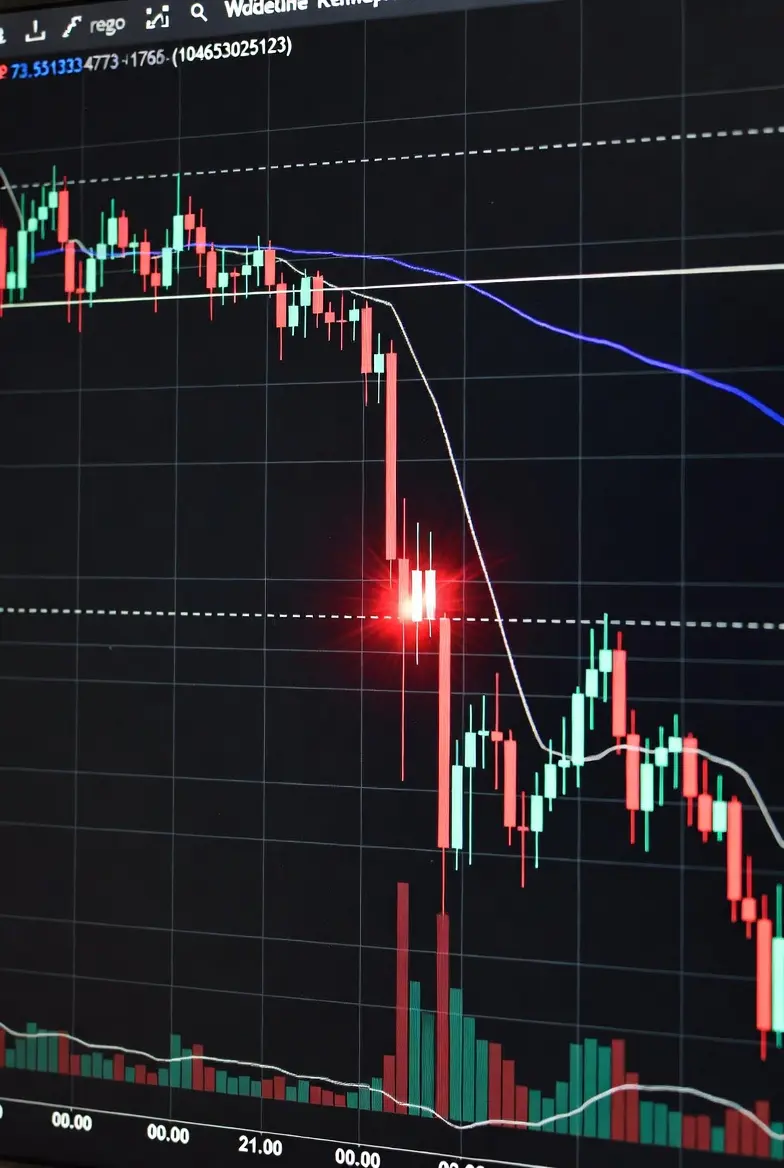
The most violent part of the latest leg lower — the wick down to ~$73,000 — occurred before or concurrently with the widest dissemination of Wood’s exact “sell gold, buy Bitcoin” phrasing in headlines.
In other words, the market was already in a clear downtrend when the headline hit trading terminals.
Did the Headline Move Price?
Almost certainly not in a meaningful, directional way.
Here’s why:
Pre-existing weakness
Bitcoin had already broken several key technical levels (e.g., below $91,000 in late 2025, then failing to hold $80,000+ zones). Momentum was bearish well.
Nature of the statement
Wood has been bullish on Bitcoin-over-gold for years. She reiterated similar views in her ARK Big Ideas 2026 report (released mid-January) and in multiple January interviews. The February comment was a fresh soundbite, not a sudden reversal or new information.
Market reaction
If anything, aggressive Bitcoin bulls might have expected a short-term bid from such a widely respected voice doubling down. Instead, price continued to grind lower — suggesting macro selling pressure (risk-off equities, potential USD strength, leveraged positions unwinding) overwhelmed any isolated headline flow.
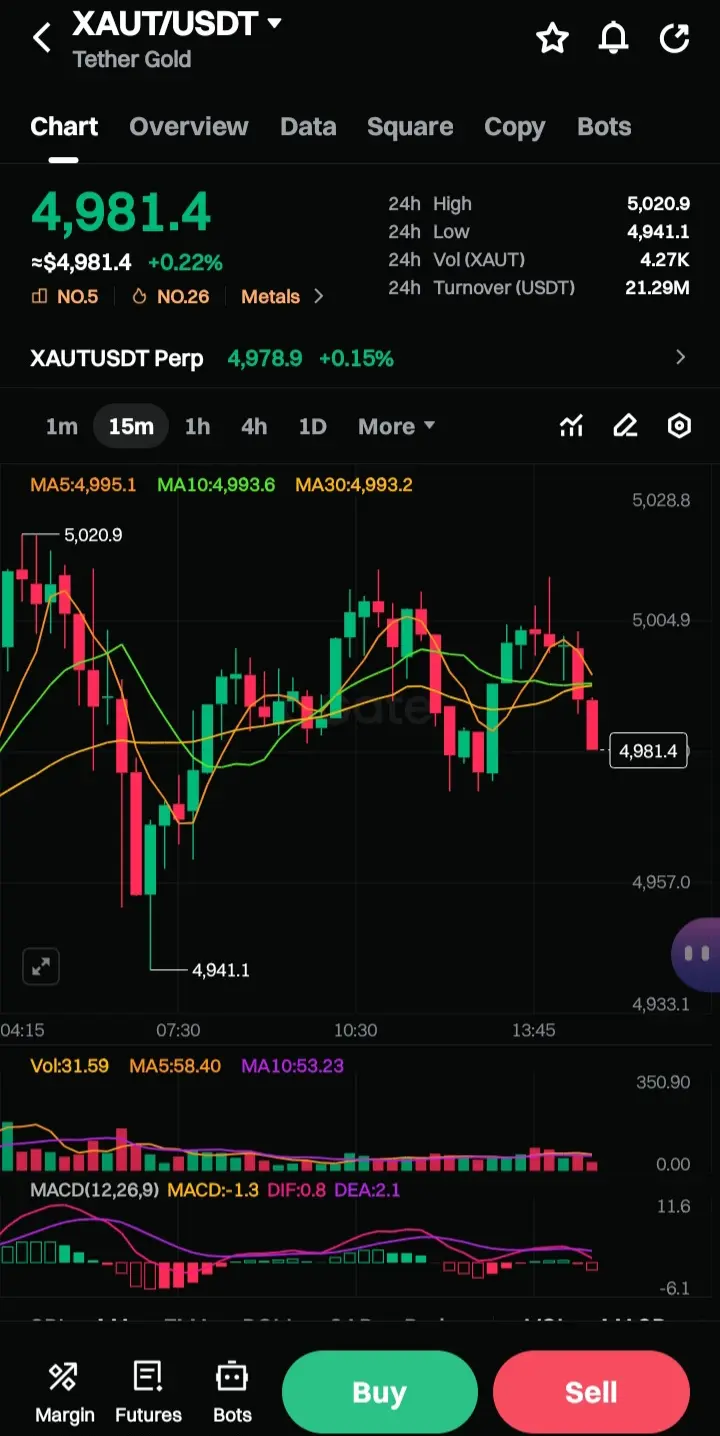
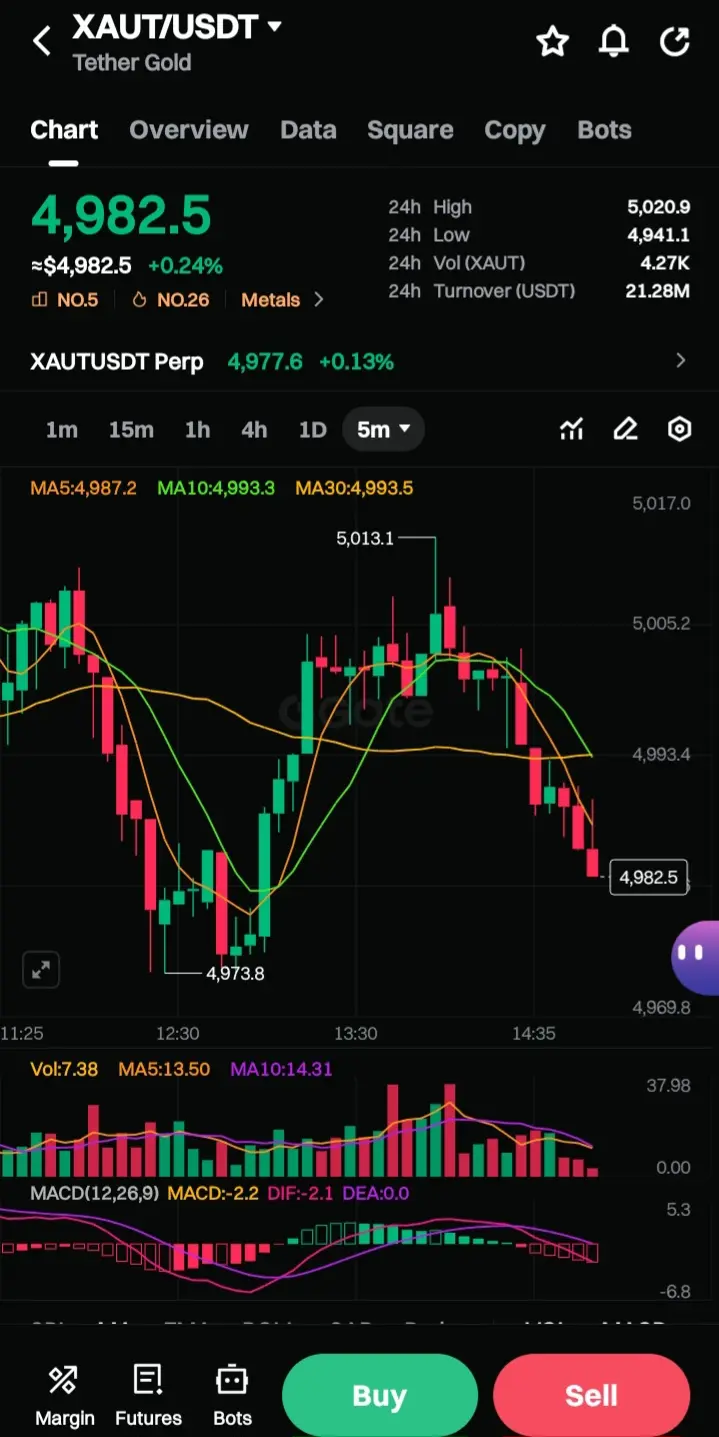
Gold’s behavior
Gold did not crash after Wood’s remarks. In fact, precious metals remained firm or even extended their own moves in some sessions, which undercuts the idea of a massive “rotation trade” actually taking place at scale.
What Actually Drove the February Dip?
More plausible drivers visible around that date:
Broad risk-off sentiment — U.S. stocks sold off, dragging correlated risk assets.
Deleveraging cascade — Crypto futures liquidations spiked during the wick to $73k.
Technical breakdown — Failure to reclaim higher timeframe moving averages and CME futures gaps acting as magnets.
Profit-taking / rotation fatigue — After Bitcoin’s strong run from late 2024 through January 2026, many traders were lightening up.
Wood’s comment arrived into that environment — it did not create it.
Takeaway for Traders & Investors
Cathie Wood’s “Sell Gold, Buy Bitcoin” line is classic headline bait: punchy, memorable, and perfectly aligned with her long-term thesis. But on February, it functioned more as confirmation noise than as a causal catalyst.
The market was already turning lower before the quote went viral.
Short-term price action remained driven by technical levels, leverage, and macro flows — not by one executive’s asset-allocation opinion, no matter how influential.
Wood’s core argument (Bitcoin’s superior supply schedule + low correlation + adoption path) remains a valid long-term framework — but it has not yet translated into immediate outperformance versus gold in 2026.
For now, Bitcoin holders are left watching the $72,900–$74,000 zone for signs of exhaustion, while gold bulls continue to argue the precious metal still has room if macro uncertainty persists.
The rotation Wood described may eventually materialize but February was not its starting gun. It was merely the latest chapter in an ongoing, multi-year debate between two scarce assets.