Trade
Basic
Futures
Futures
Hundreds of contracts settled in USDT or BTC
TradFi
Gold
Trade global traditional assets with USDT in one place
Options
Hot
Trade European-style vanilla options
Unified Account
Maximize your capital efficiency
Demo Trading
Futures Kickoff
Get prepared for your futures trading
Futures Events
Participate in events to win generous rewards
Demo Trading
Use virtual funds to experience risk-free trading
Earn
Launch
CandyDrop
Collect candies to earn airdrops
Launchpool
Quick staking, earn potential new tokens
HODLer Airdrop
Hold GT and get massive airdrops for free
Launchpad
Be early to the next big token project
Alpha Points
Trade on-chain assets and enjoy airdrop rewards!
Futures Points
Earn futures points and claim airdrop rewards
Investment
Simple Earn
Earn interests with idle tokens
Auto-Invest
Auto-invest on a regular basis
Dual Investment
Buy low and sell high to take profits from price fluctuations
Soft Staking
Earn rewards with flexible staking
Crypto Loan
0 Fees
Pledge one crypto to borrow another
Lending Center
One-stop lending hub
VIP Wealth Hub
Customized wealth management empowers your assets growth
Private Wealth Management
Customized asset management to grow your digital assets
Quant Fund
Top asset management team helps you profit without hassle
Staking
Stake cryptos to earn in PoS products
Smart Leverage
New
No forced liquidation before maturity, worry-free leveraged gains
GUSD Minting
Use USDT/USDC to mint GUSD for treasury-level yields
More
INVESTERCLUB
No content yet
INVESTERCLUB
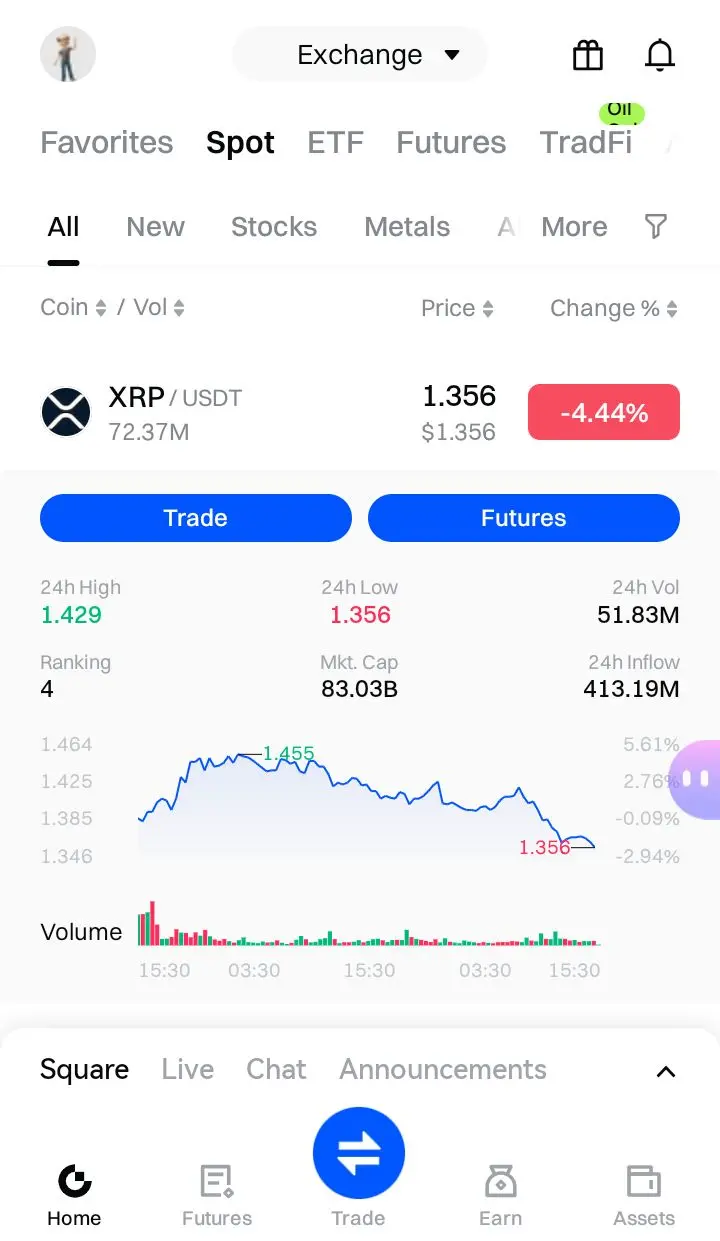
$XRP #CryptoSurvivalGuide
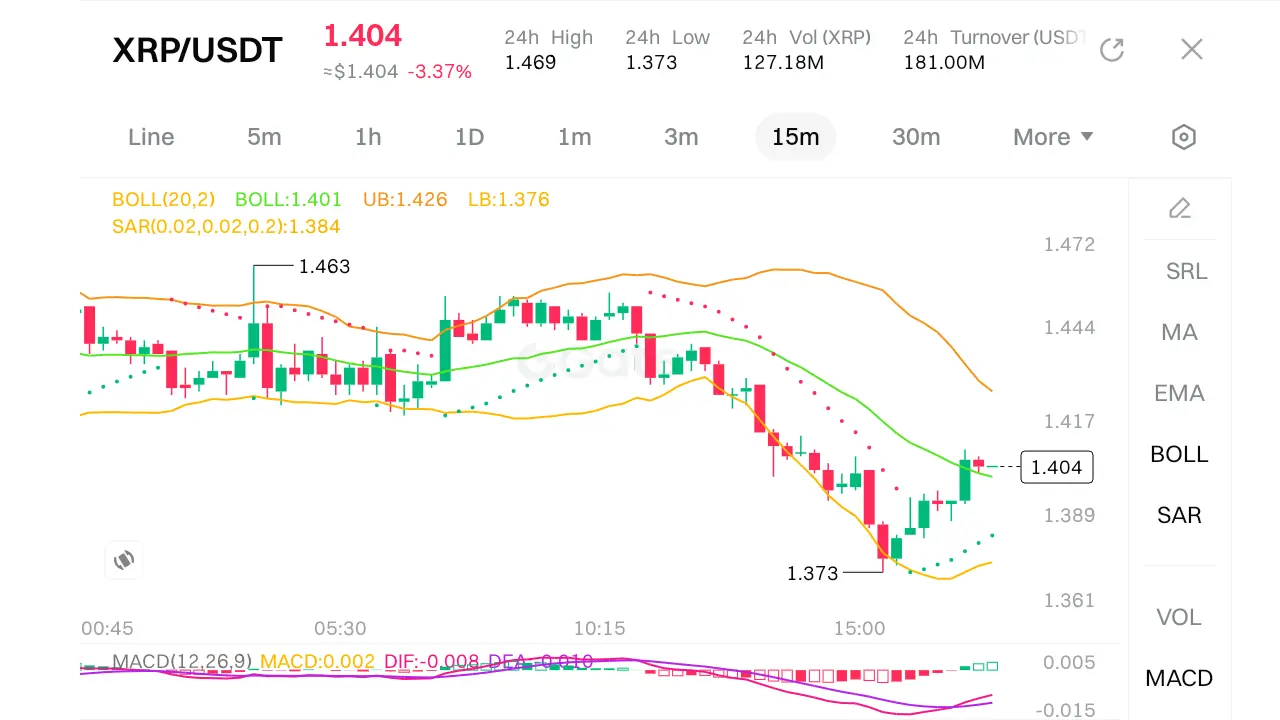
XRP Price Retreats After Rejecting $1.55, Support at $1.34 in Focus
XRP faced renewed selling pressure after failing to clear the $1.55 resistance, mirroring pullbacks in Bitcoin and Ethereum. The token has since dropped below $1.45 and $1.48, entering a corrective phase that brought it under the 23.6% Fibonacci retracement level—calculated from the $1.1356 swing low to the $1.5435 high.
On the hourly chart, a declining channel has formed, with immediate resistance now resting at $1.43. XRP is trading beneath both $1.42 and the 100-hour simple moving average, signali
XRP-1,77%

- Reward
- 2
- Comment
- Repost
- Share
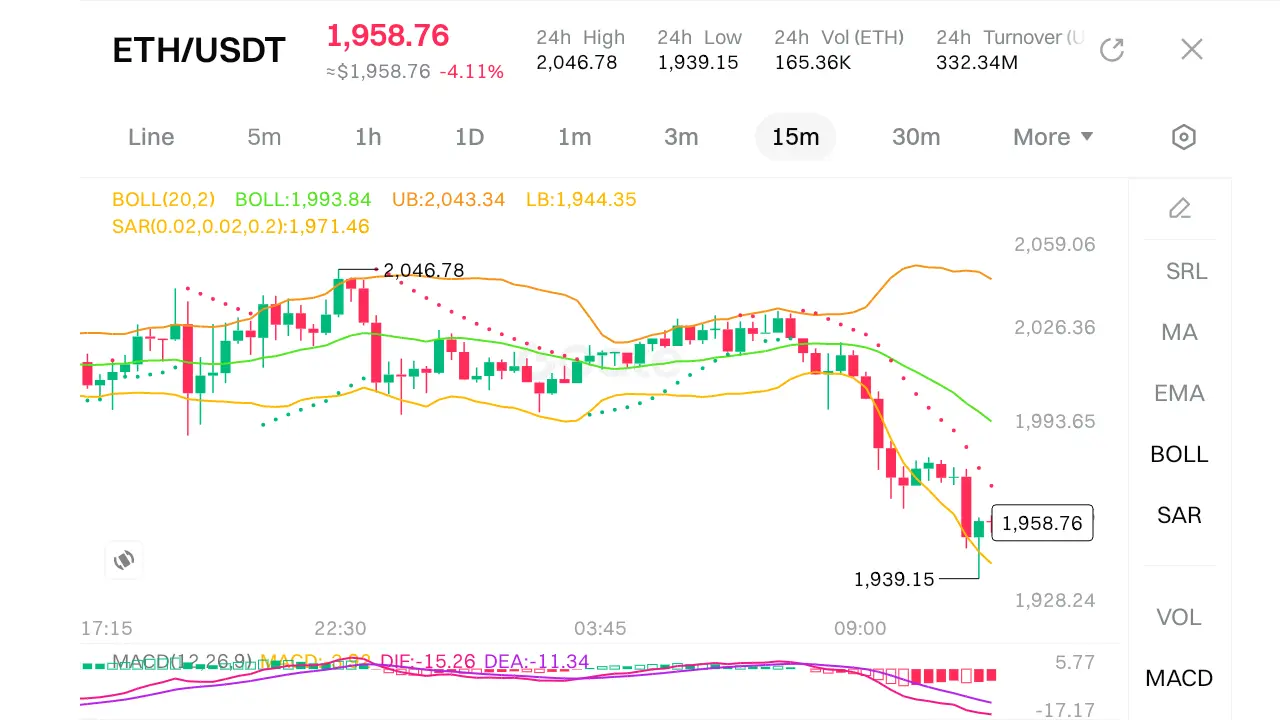
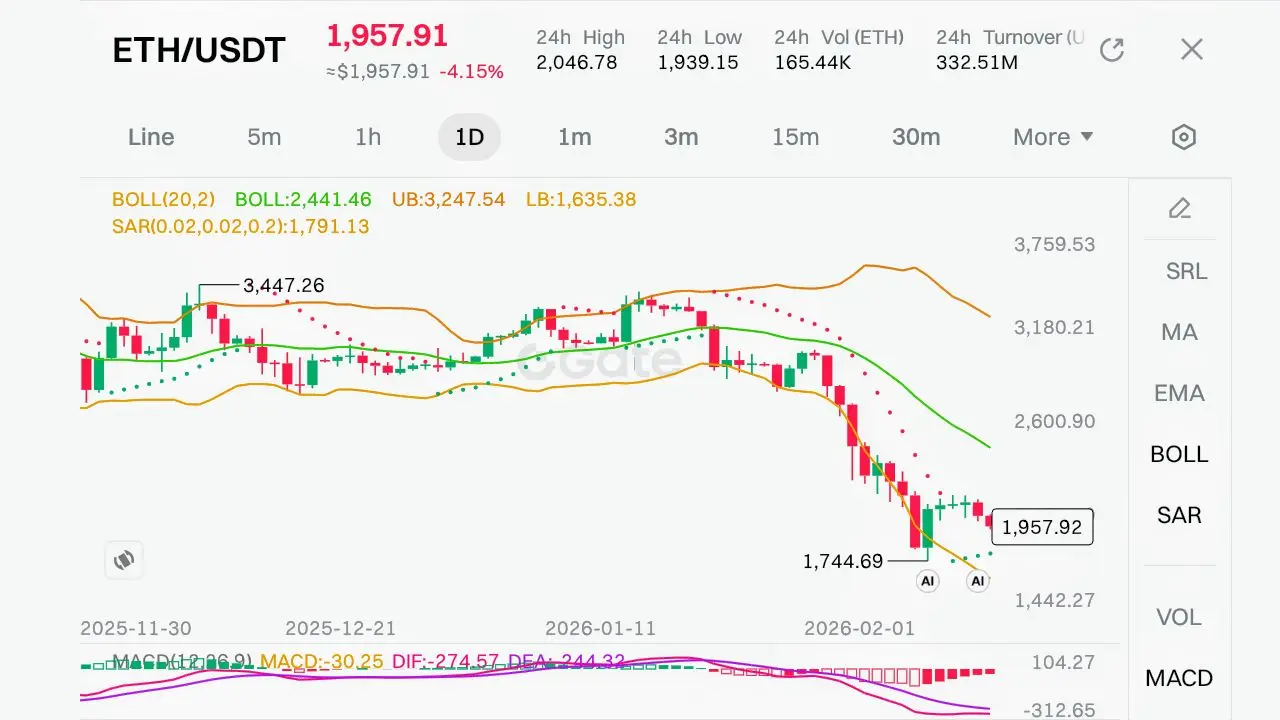
$ETH #CryptoSurvivalGuide
ETH/USDT chart data and trading terminology, here is a concise technical analysis summary:
📈 Multi-Timeframe Analysis (ETH/USDT)
Current Price: ≈ $1,957.91 (4h chart)
Overall Trend: Bearish across all timeframes, price below Bollinger Band mid-line, MACD negative.
⏳ Timeframe Breakdown:
1. 5-min Chart (Very Short-Term)
· BOLL: Price near lower band (LB: 1,944.35), slight rebound visible.
· MACD: DIF (15.26) > DEA (11.34), histogram positive → short-term momentum slightly bullish.
· Watch for: Possible TS (Turtle Soup) or pullback to mid-band (1,993.84).
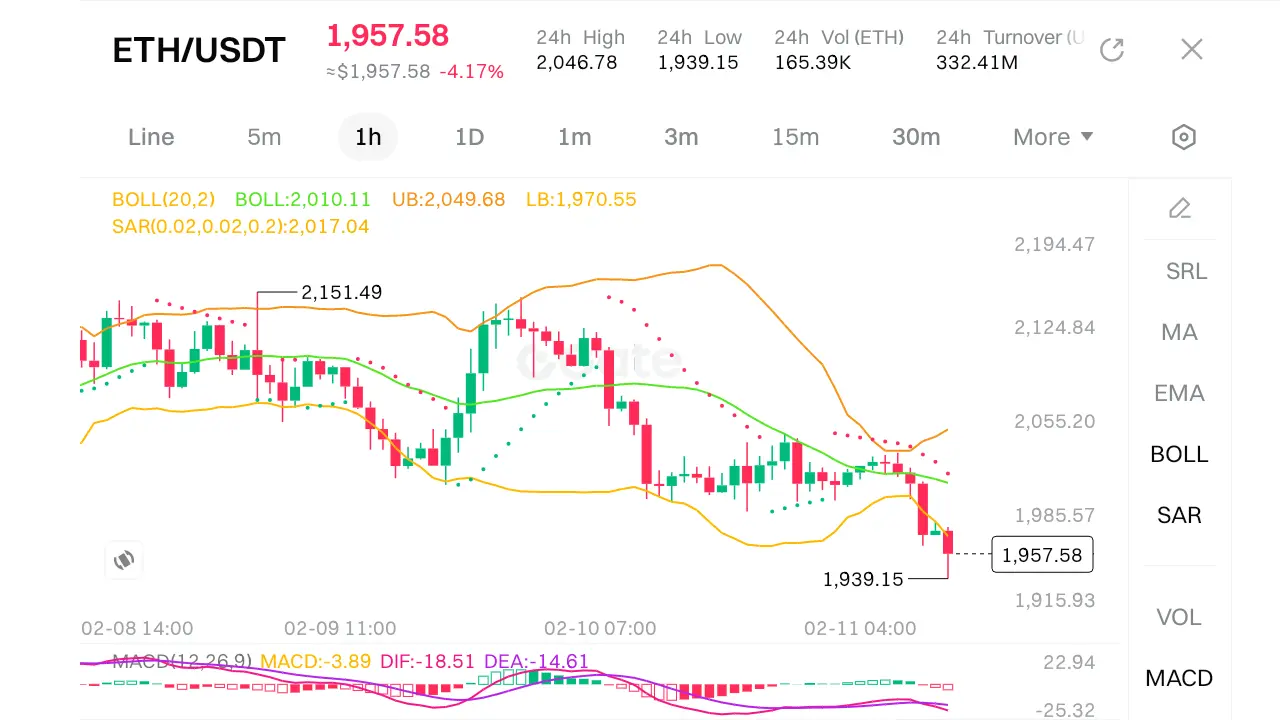
2. 1-hour Ch
ETH/USDT chart data and trading terminology, here is a concise technical analysis summary:
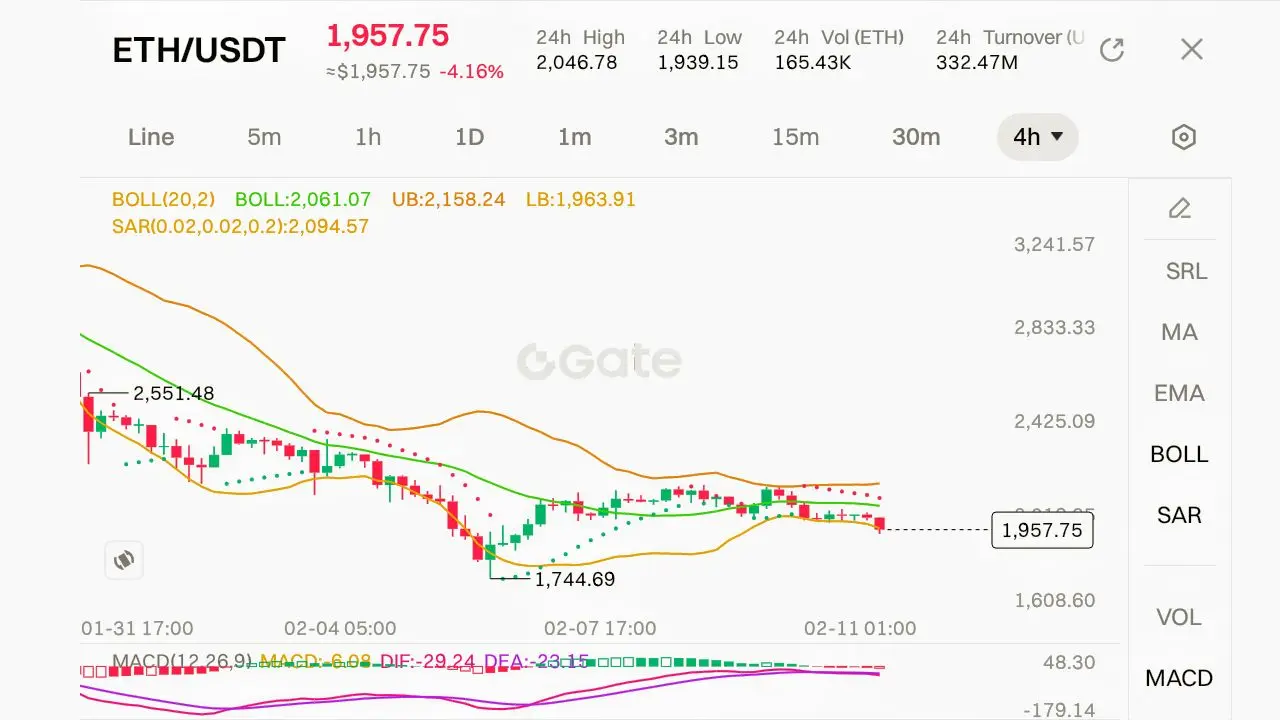
📈 Multi-Timeframe Analysis (ETH/USDT)
Current Price: ≈ $1,957.91 (4h chart)
Overall Trend: Bearish across all timeframes, price below Bollinger Band mid-line, MACD negative.
⏳ Timeframe Breakdown:
1. 5-min Chart (Very Short-Term)
· BOLL: Price near lower band (LB: 1,944.35), slight rebound visible.
· MACD: DIF (15.26) > DEA (11.34), histogram positive → short-term momentum slightly bullish.
· Watch for: Possible TS (Turtle Soup) or pullback to mid-band (1,993.84).
2. 1-hour Ch
ETH-3,3%
- Reward
- 2
- 1
- Repost
- Share
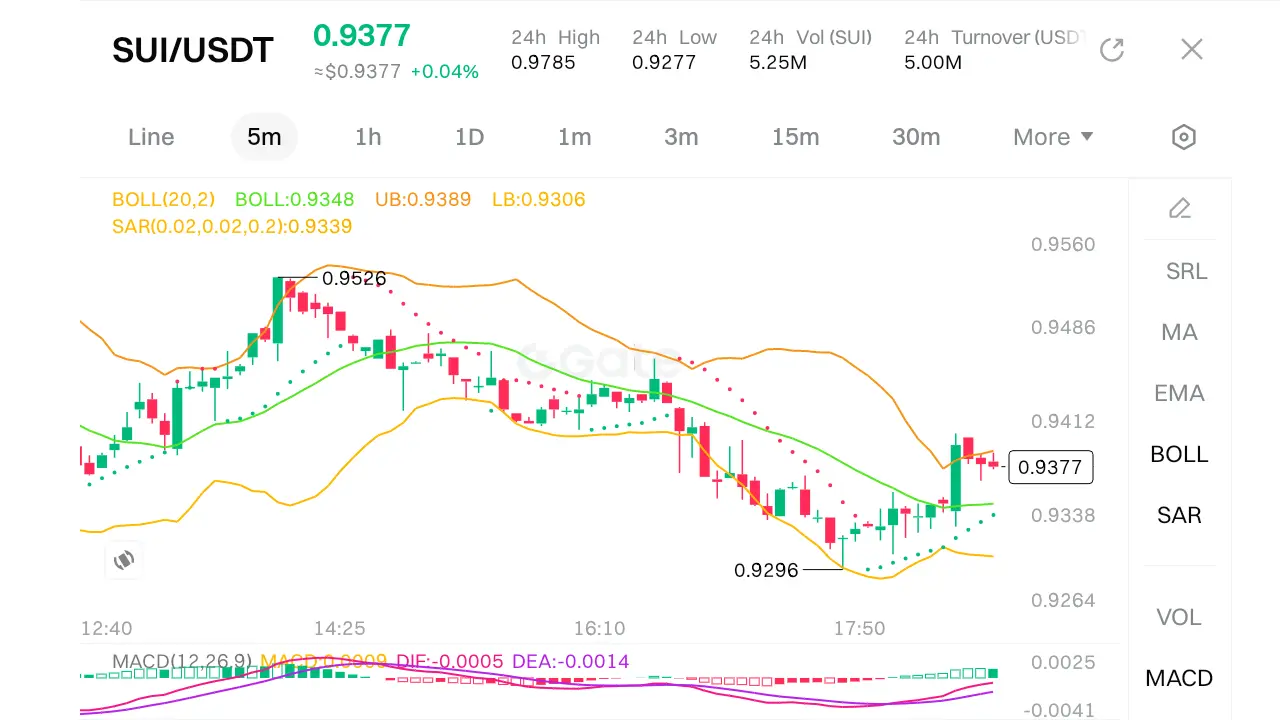
EqunixHub:
nice trading style and strategy#BuyTheDipOrWaitNow? SUI/USDT, here is an analysis and actionable trade plan following your 5-step strategy:
1) 4H Liquidity (Higher Timeframe Context)
· Chart Reference: (1D/4H view).
· Key Levels:
· Resistance (Sell-Side Liquidity): The recent high near 0.9785 (24h High) and the BOLL Upper Band (UB) at 1.0196 are key liquidity zones. The price was rejected from this area.
· Support (Buy-Side Liquidity): The 24h Low at 0.9277 aligns almost perfectly with the BOLL Lower Band (LB) at 0.9272. This is a major support and liquidity zone.
· Bias: The price is in the lower half of the 4H Bolling
SUI-2,75%
- Reward
- 3
- 5
- Repost
- Share
DEATHLESS:
Happy New Year! 🤑View More
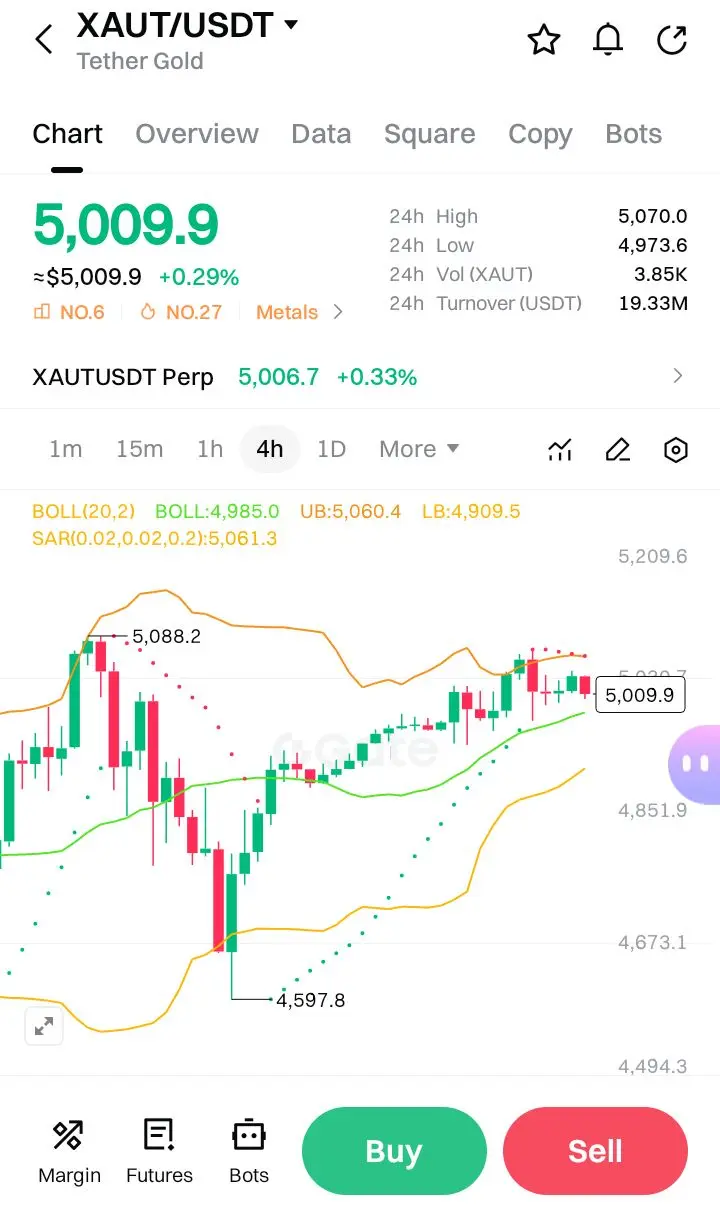
$XAUT #GateSpringFestivalHorseRacingEvent
comprehensive in-depth K-line analysis for the XAUT/USDT (Tether Gold perpetual) chart:
1. Overall Trend & Market Context
· Primary Trend: The chart depicts a market in a downtrend, followed by a period of consolidation. The price has fallen from highs around 5,088.2 and appears to be stabilizing after finding a low near 4,494.3.
· Current Phase: The market is in a consolidation/range-bound phase between approximately 4,900 and 5,070. This follows a significant decline, indicating a potential pause or accumulation before the next directional move.
2.
XAUT0,32%

- Reward
- 3
- Comment
- Repost
- Share
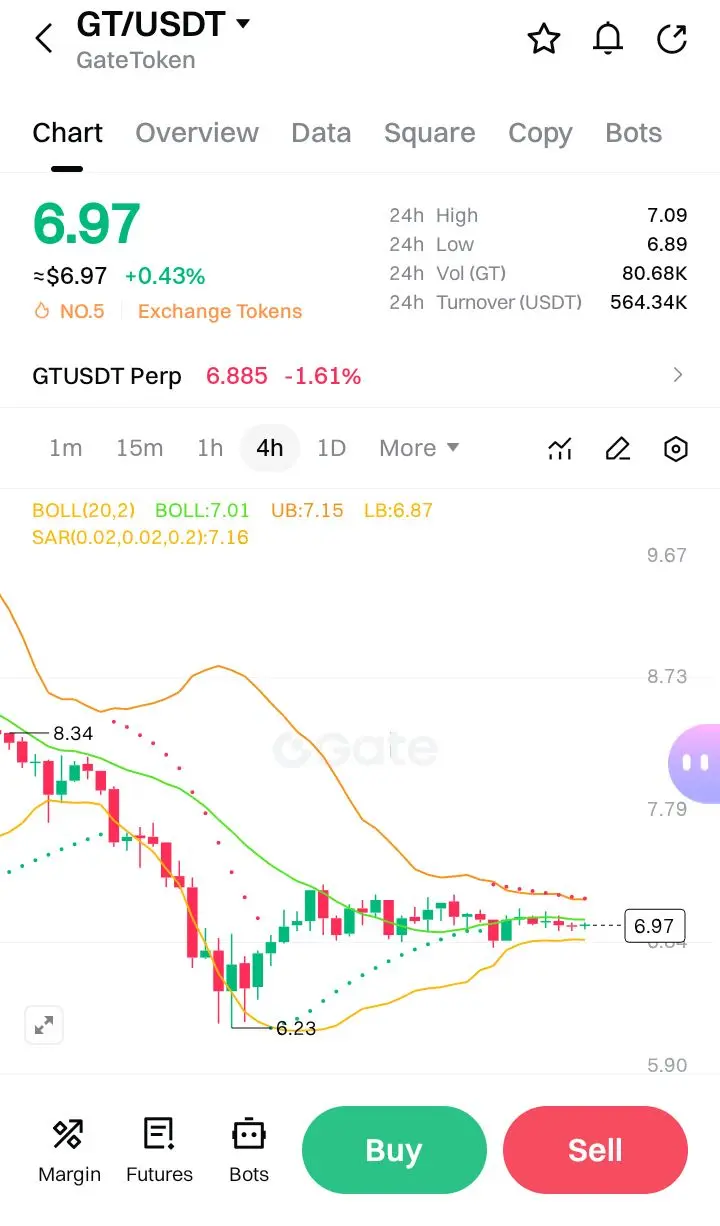
$GT #GateSpringFestivalHorseRacingEvent
Here's a technical analysis for GT/USDT on the 4-hour timeframe:
Current Snapshot & Trend
· Price: ~6.97 USDT (Spot) / 6.885 USDT (Perp Futures, down -1.61%)
· Short-Term Trend: Bearish. The futures price is significantly below the spot, and the chart shows a clear decline from the ~7.79 level.
Key Technical Indicators
1. Bollinger Bands (20,2):
· Price is trading at the Lower Band (LB: 6.87), indicating the asset is in oversold territory for this timeframe.
· The middle band (BOLL: 7.01) and upper band (UB: 7.15) are acting as immediate resistanc
GT-1,86%

- Reward
- 2
- Comment
- Repost
- Share
$ETH #GateSpringFestivalHorseRacingEvent
ETH/USDT, here is a technical analysis:
1. Current Price Action & Trend
· Current Price: ~$2,011.96
· 24h Change: -1.02% (bearish short-term momentum)
· 24h Range: $1,996.00 – $2,147.60
· The price is currently trading below the Bollinger Band midline ($2,073.83), indicating bearish pressure.
2. Bollinger Bands (20,2) Analysis
· Midline (BOLL): $2,073.83
· Upper Band (UB): $2,150.69
· Lower Band (LB): $1,996.97
· Price Position: Currently near the lower band, suggesting oversold conditions in the very short term.
· Band Width: The distance between UB a
ETH-3,3%
- Reward
- 2
- Comment
- Repost
- Share
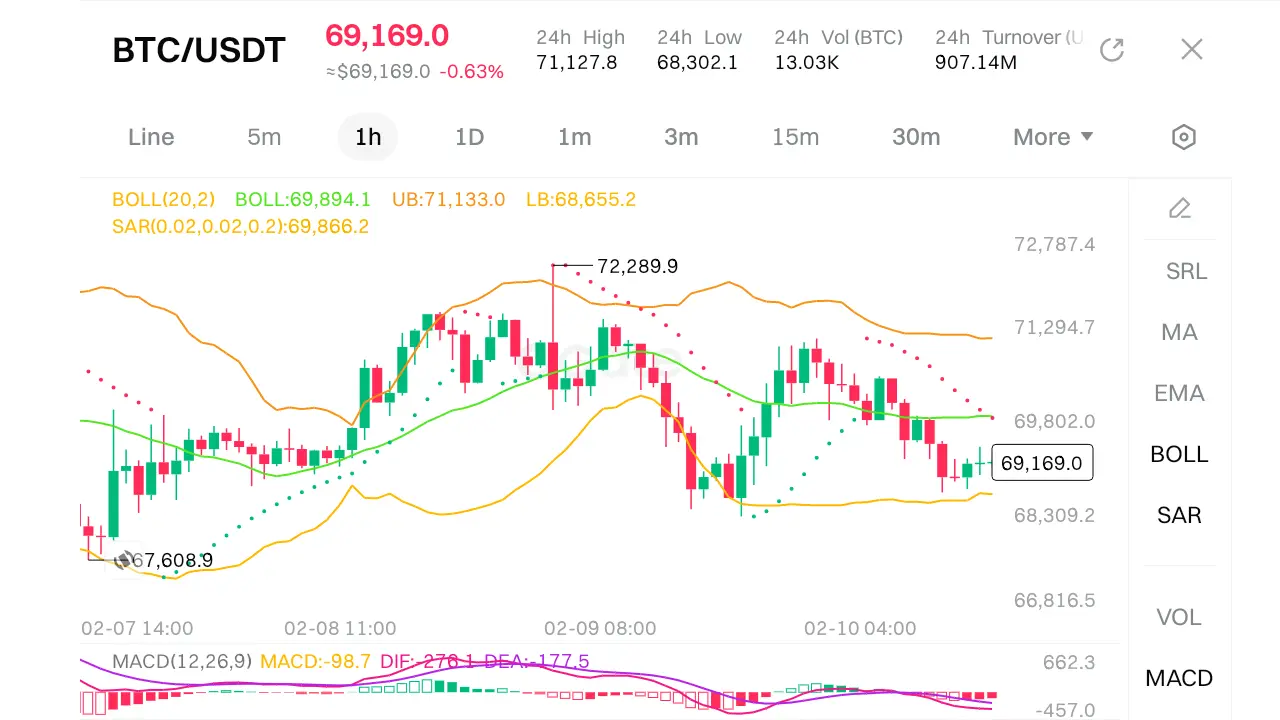
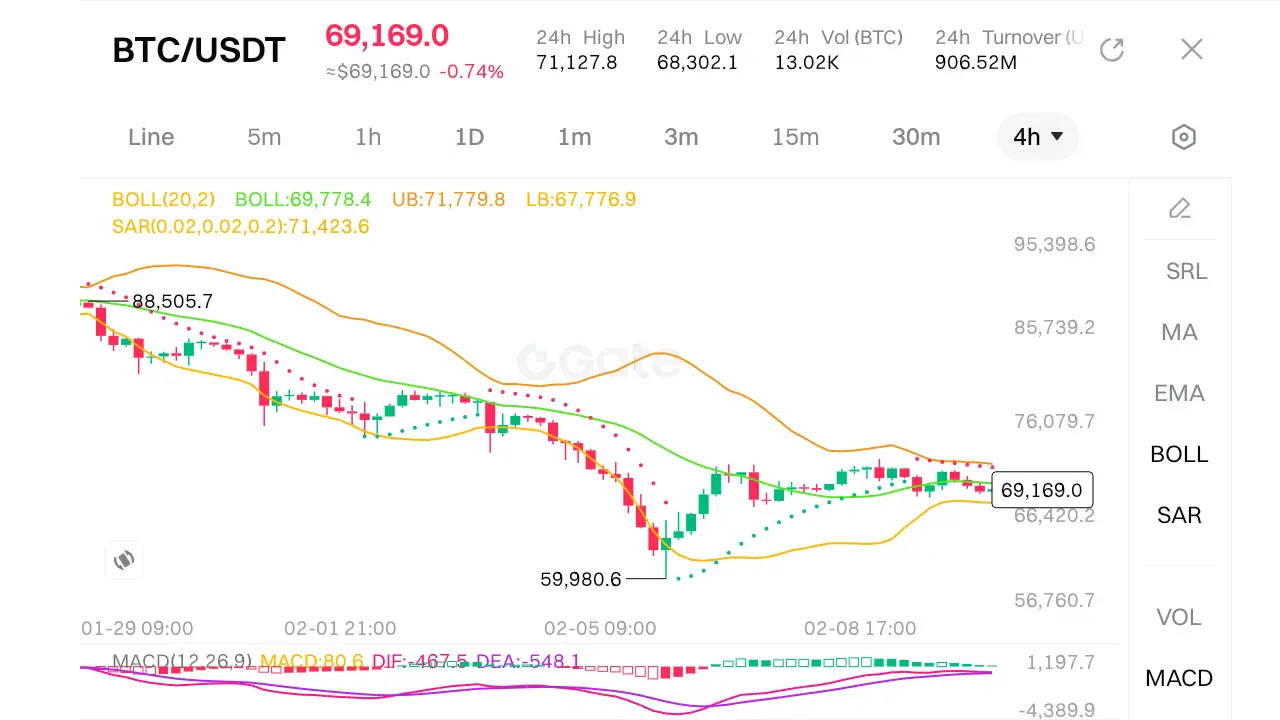
$BTC #GateSpringFestivalHorseRacingEvent
Reconciled Data & Current Snapshot
· Price: 69,169.0 USDT
· 24h Range: 68,302.1 (Low) - 71,127.8 (High)
· Key Level (from SAR): 71,423.6 (Resistance - from 2nd screenshot). The shows SAR at 69,866.2 (support-turned-resistance).
· Bollinger Bands (20,2): Middle (BOLL) ~69,778 | Upper (UB) ~71,133 | Lower (LB) ~68,655
· MACD: Appears conflicted. shows negative MACD (-98.7), suggesting bearish momentum. The 2nd shows positive (80.6). We'll prioritize price relative to structure.
In-Depth Technical Analysis
1. Market Structure & Key Levels:
· Trend & Phase
BTC-2,35%
- Reward
- 2
- 2
- Repost
- Share
Lock_433 :
:
2026 GOGOGO 👊View More
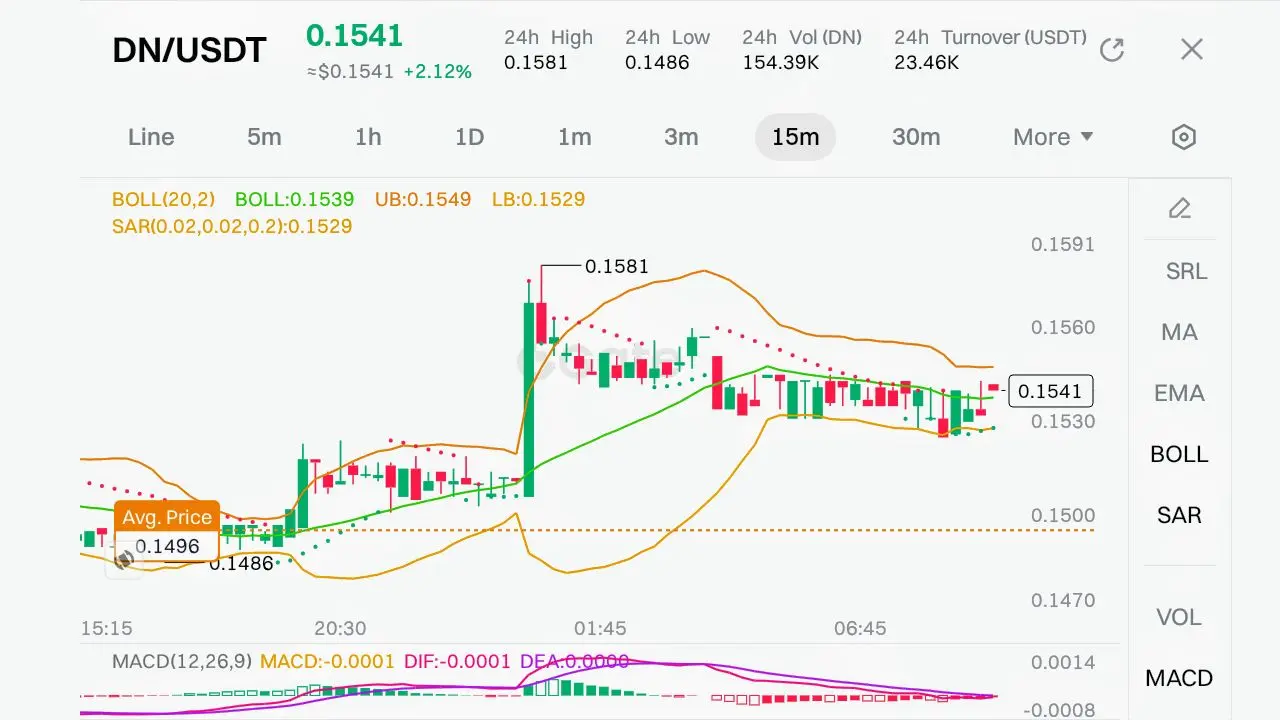
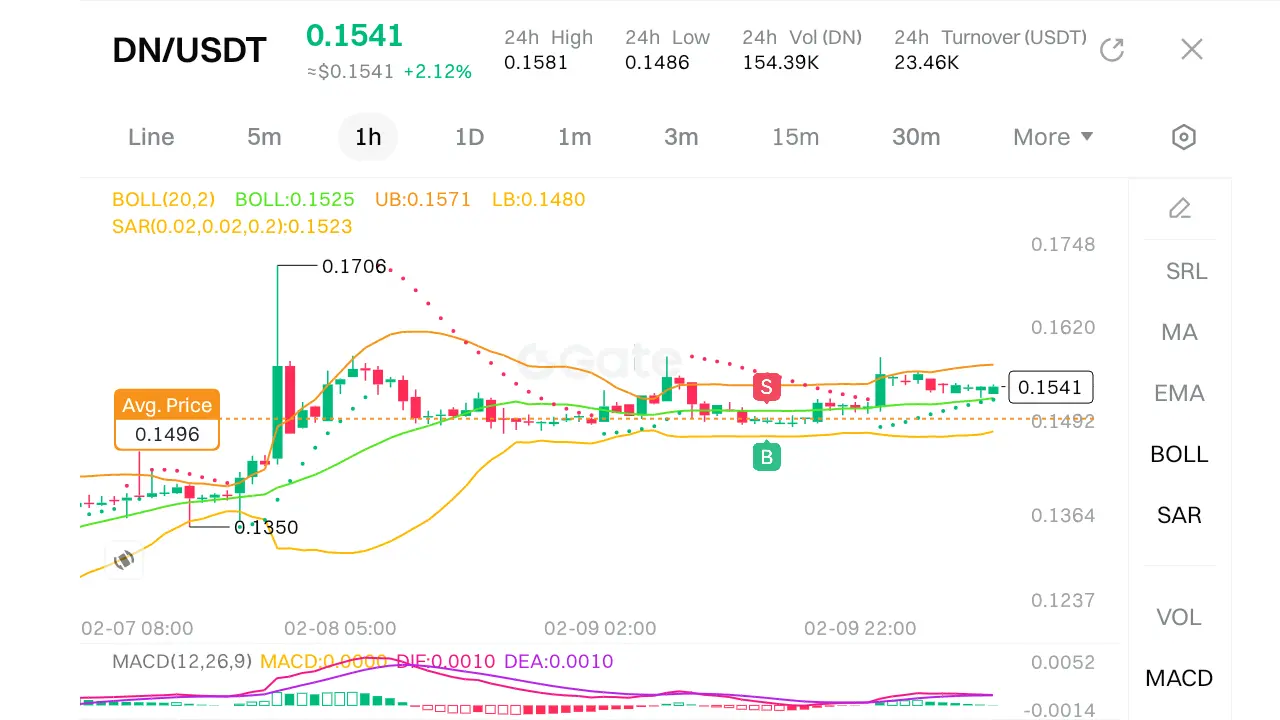
$DN #BuyTheDipOrWaitNow?
DN/USDT, here is a technical analysis and trade plan structured around Dow Theory principles.
1. Market Structure & Trend Analysis (Dow Theory Framework)
Primary Trend (Long-Term)
· Price Action: Current price (≈0.1541) is above the 24h average (0.1496) and near the middle Bollinger Band.
· Highs & Lows:
· 24h High: 0.1581
· 24h Low: 0.1486
· Volume: Moderate (154.39K DN / 23.46K USDT turnover), not exceptionally high, suggesting lack of strong conviction.
Observation:
The price is consolidating between 0.1486–0.1581. A break above 0.1581 with volume would signal
DN1,12%
- Reward
- 2
- Comment
- Repost
- Share
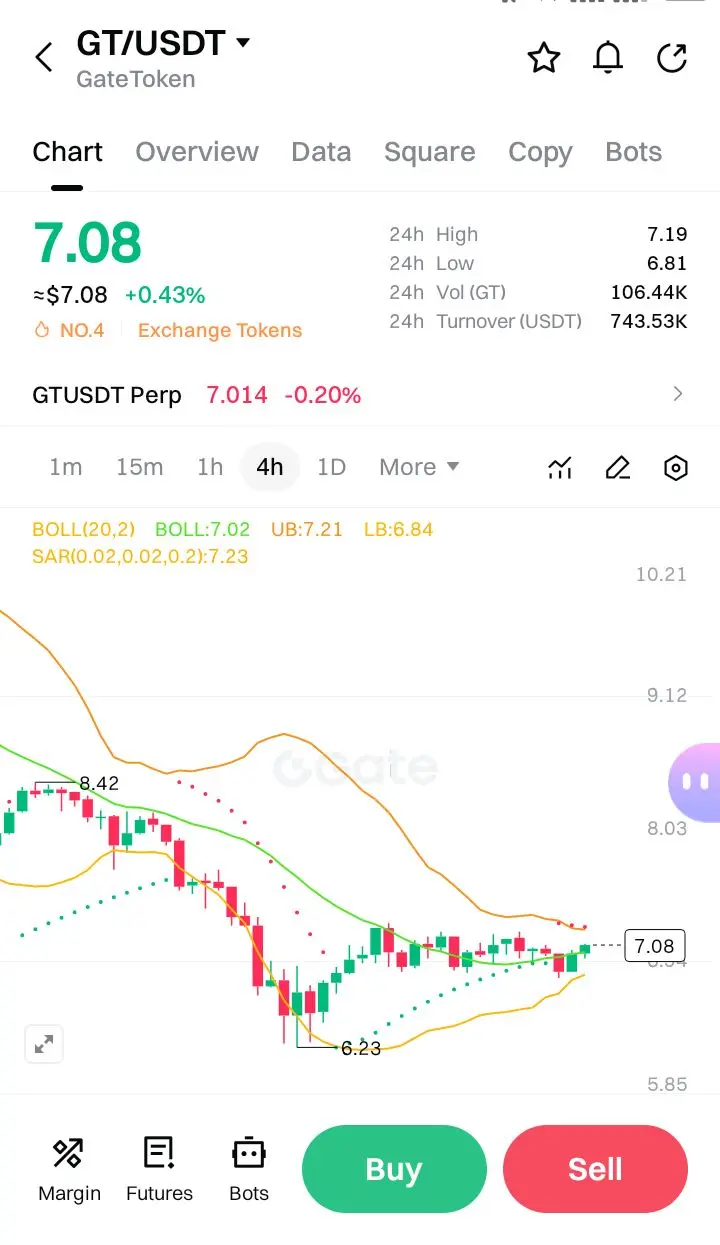
$GT #BitcoinBouncesBack
Here is a detailed technical analysis of the GT/USDT pair:
Overall Trend & Market Context
The chart shows GT/USDT in a corrective phase within a broader bullish structure. The price has rejected strongly from the Upper Bollinger Band (UB: 9.02) and is now trading near the Middle Bollinger Band (BOLL: 7.60), indicating a loss of upward momentum in the short term.
Key Technical Indicators & Patterns
1. Bollinger Bands (20,2) Analysis
· Current Position: Price (~7.08) has broken below the middle band (7.60), which acts as dynamic resistance. This is a bearish short-term s
GT-1,86%
- Reward
- 3
- 3
- Repost
- Share
INVESTERCLUB:
Parabolic SAR flipped bearish—short-term momentum has shifted. Until GT reclaims $7.60, rallies are likely selling opportunitiesView More
$XRP #BuyTheDipOrWaitNow?
The Great XRP Divide: Whales Accumulate as Retail Traders Retreat;
XRP Grinds at $1.40 as Retail Flees, Whales Hold the Line
The XRP rally has stalled. Stuck near $1.40, the asset is caught between cautious whales and an exodus of retail interest, painting a picture of fragile equilibrium in a nervous market.
From Crash to Dead Bounce: A Volatile Week
Last week’s plunge to a yearly low of $1.12 was met with a sharp, yet unconvincing, rebound to $1.54. That move has now fully deflated, leaving price action languishing at a critical pivot. This isn't consolidation it's
XRP-1,77%
- Reward
- 2
- 2
- Repost
- Share
EqunixHub:
Below 1.43 → downside risk remains Break & hold above 1.43 with volume → move toward 1.45–1.46
View More
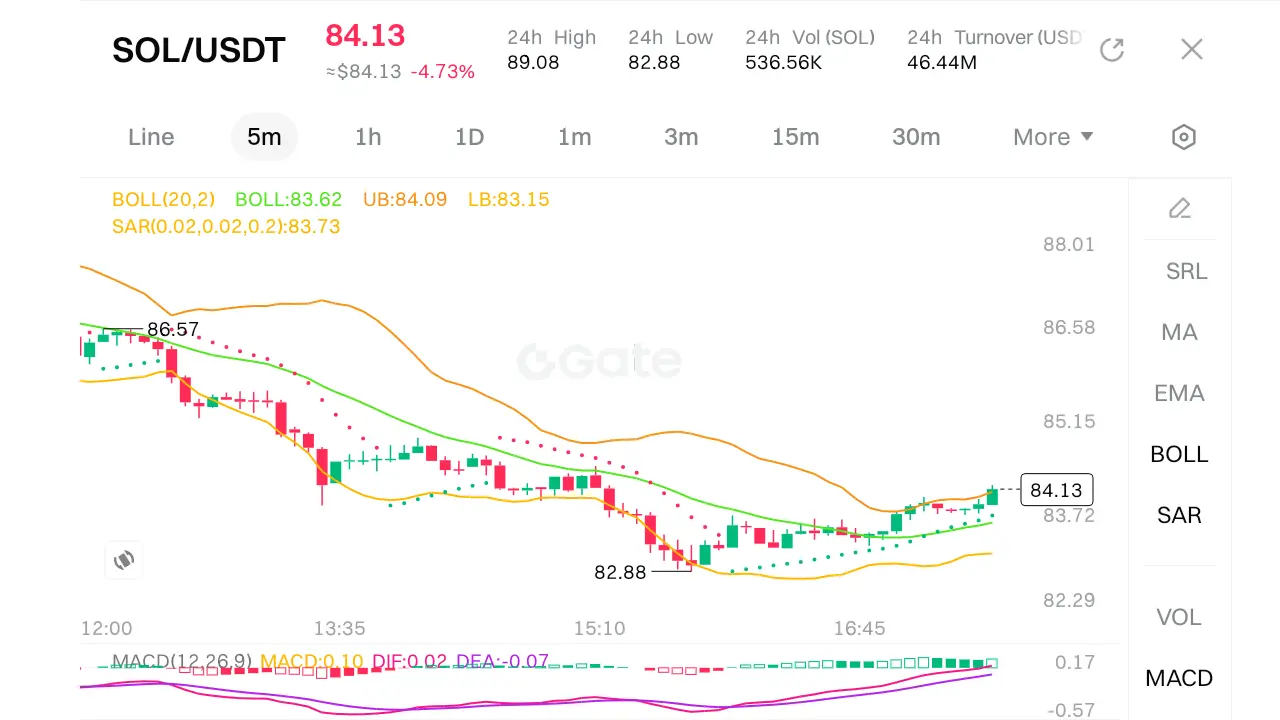
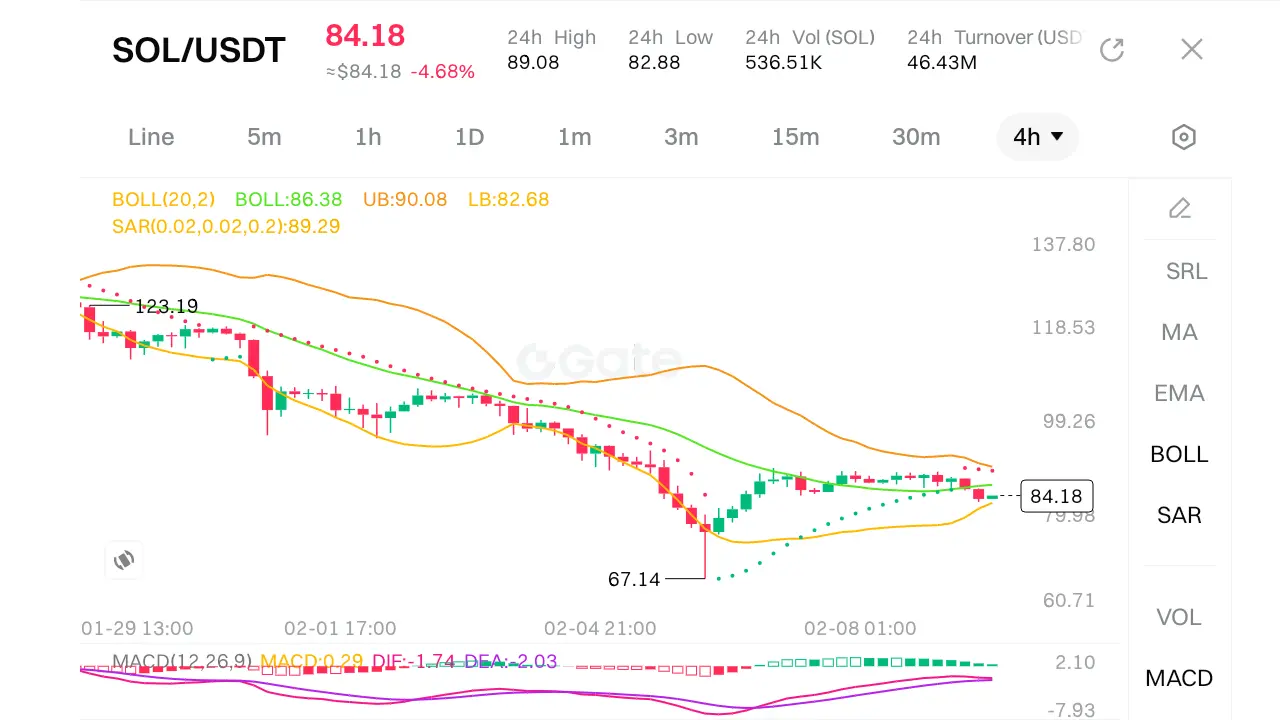
$SOL #BitcoinBouncesBack
SOL/USDT chart data and strategy components, here is a breakdown of how the 4H Liquidity, 5 Min Sweep, FVG, Entry, and 3RR strategy could be applied to the current market structure.
Market Context
The daily chart shows SOL in a significant downtrend from a high near $123** to the current price of **~$84. The MACD is bearish (DIF and DEA negative), and the price is below the Bollinger Band midline (BOLL: 86.38), indicating selling pressure.
Applied Trading Strategy Plan
1) 4H Liquidity (Higher Timeframe Target Zones)
· Purpose: Identify key areas where stop losses are
SOL-4,26%
- Reward
- 3
- Comment
- Repost
- Share
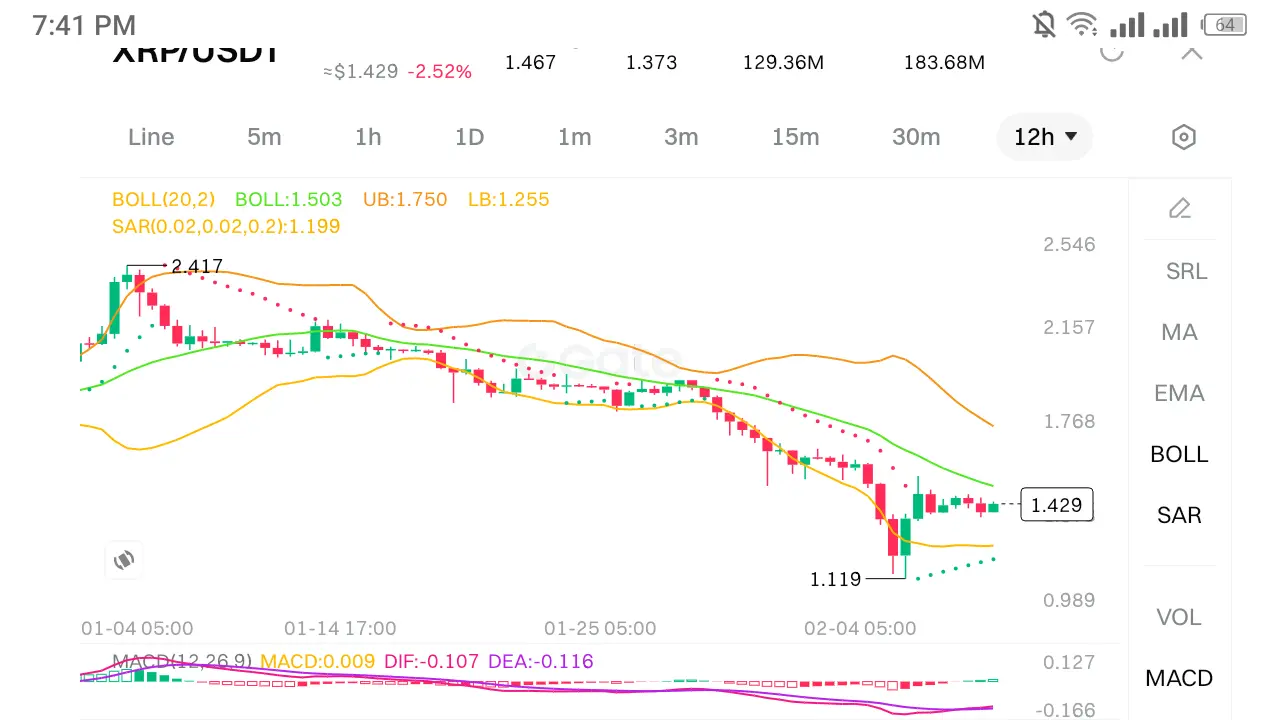
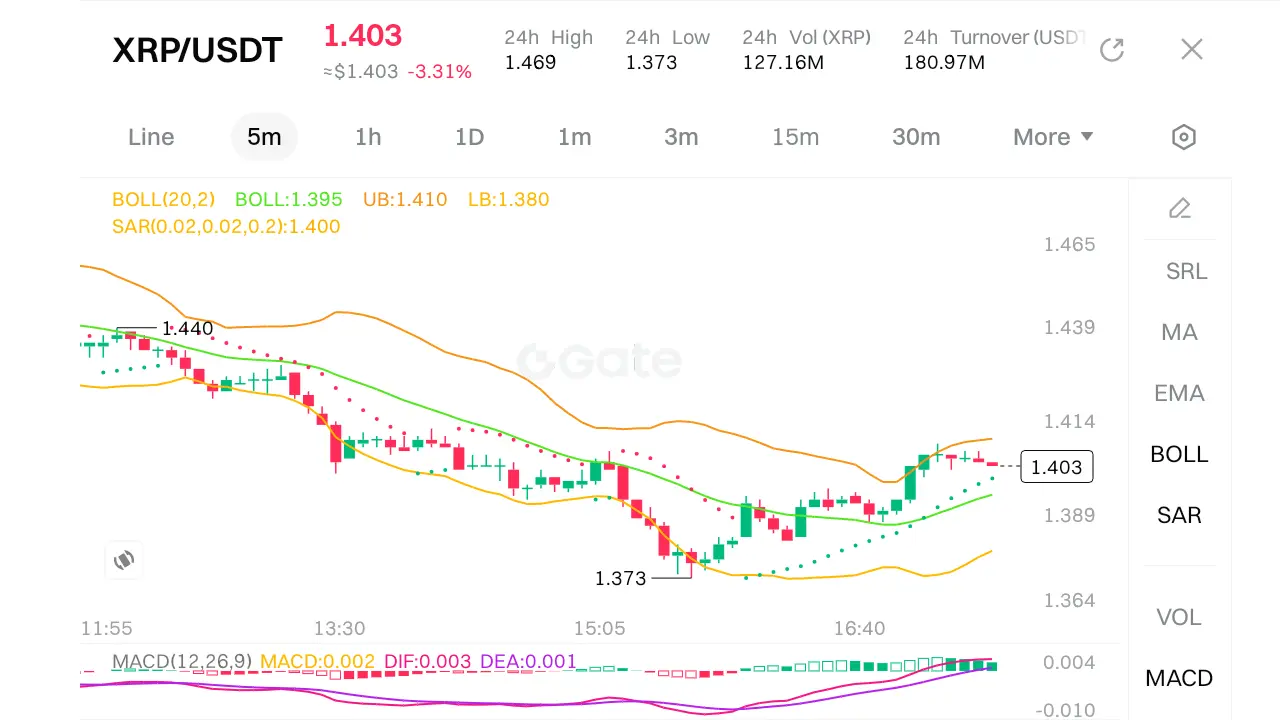
$XRP #GateSquareValentineGiveaway
XRP/USDT focusing on Market Structure, Breakout, Pullback, and Order Block.
1. Market Structure (Trend & Phase)
· Primary Trend (1D Chart): The long-term chart shows a clear and strong downtrend. The price made a significant lower low (around 0.55) after breaking down from a major consolidation zone (approx. 1.80-1.00). The current price (~1.40) is in a phase of corrective pullback within this larger bearish structure.
· Short-Term Structure (5m/1h): On lower timeframes, the market is in a state of consolidation or a weak bearish retest. The price is oscillat
XRP-1,77%
- Reward
- 2
- 1
- Repost
- Share
DEATHLESS:
Happy New Year! 🤑#BitcoinBouncesBack $BTC BITCOIN’S 21 MILLION IS INCHAIN BUT THE MARKET PRICES PAPER. HERE’S WHY SUPPLY SCARCITY NO LONGER DRIVES PRICE.
If you’re still watching only spot flows to gauge Bitcoin’s direction, you’re trading in the past. Price discovery has moved.
The original thesis was simple: fixed supply, verifiable scarcity. Valuation was built on the movement of real coins.
That changed when derivatives volume overtook spot. Now, price reacts to leverage, positioning, and liquidation cascades—not just coin availability.
THE NEW LAYER: SYNTHETIC EXPOSURE
On top of Bitcoin’s immutable base
BTC-2,35%

- Reward
- 2
- 1
- Repost
- Share
AnnaCryptoWriter:
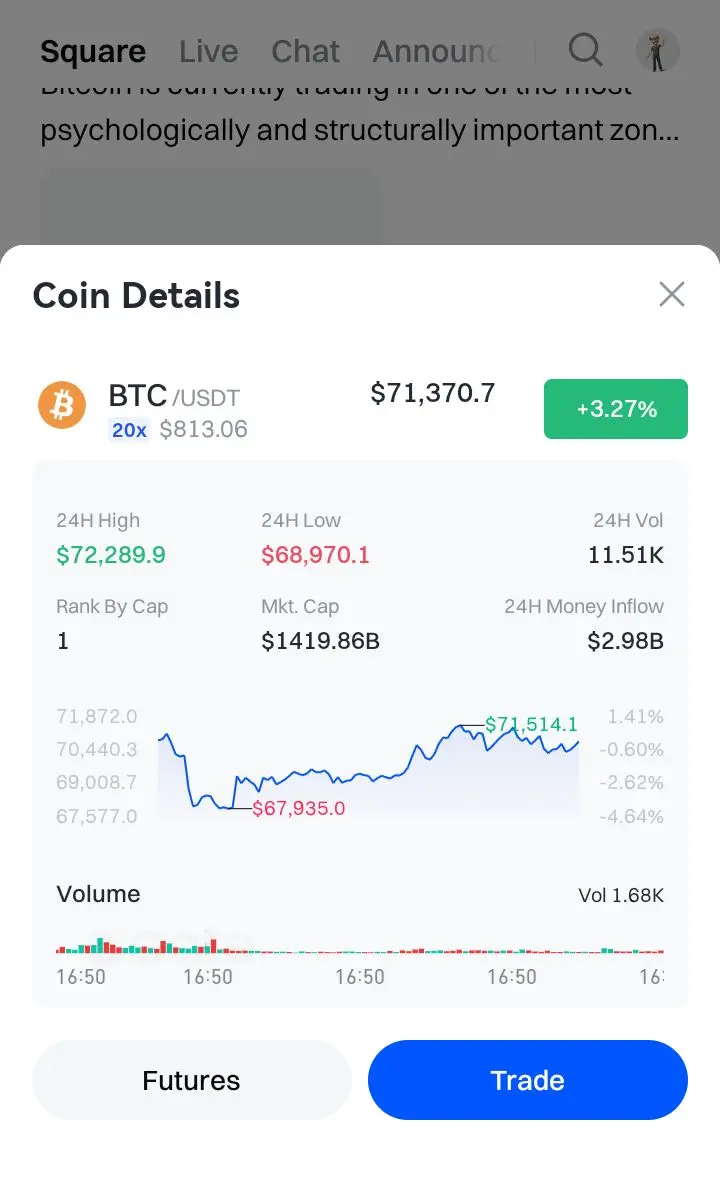
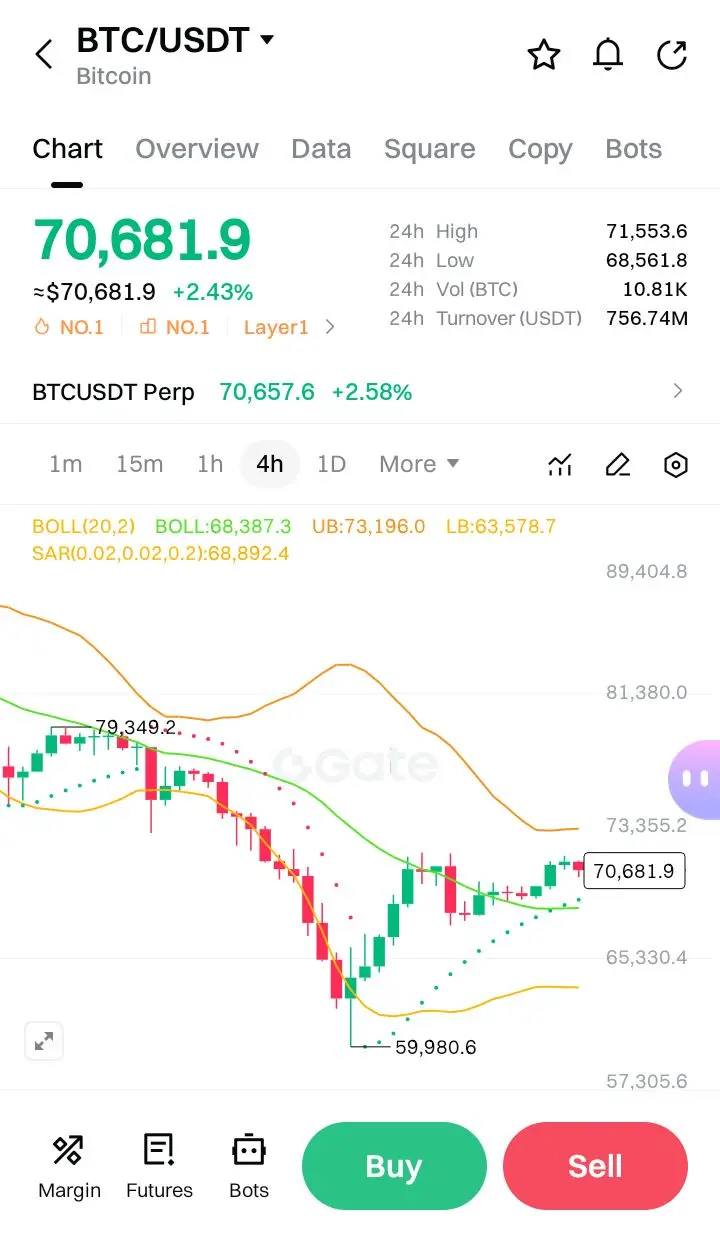
Hold tight 💪$BTC #CryptoSurvivalGuide
Here is a market structure analysis and a concise trade plan using principles from DAW Theory (Dow, Auction Market, and Wyckoff concepts).
Market Structure Analysis (DAW Lens)
1. Market Context & Phase:
· The price is in a clear uptrend on higher timeframes (as indicated by the +2.43% 24h change and recent highs near $71,553).
· Currently, price ($70,686) is consolidating just below the recent 24h high ($71,553.6). This represents a potential re-accumulation zone or a minor distribution area before the next move.
· The consistent 24h low ($68,561.8) is a maj
BTC-2,35%
- Reward
- 2
- Comment
- Repost
- Share
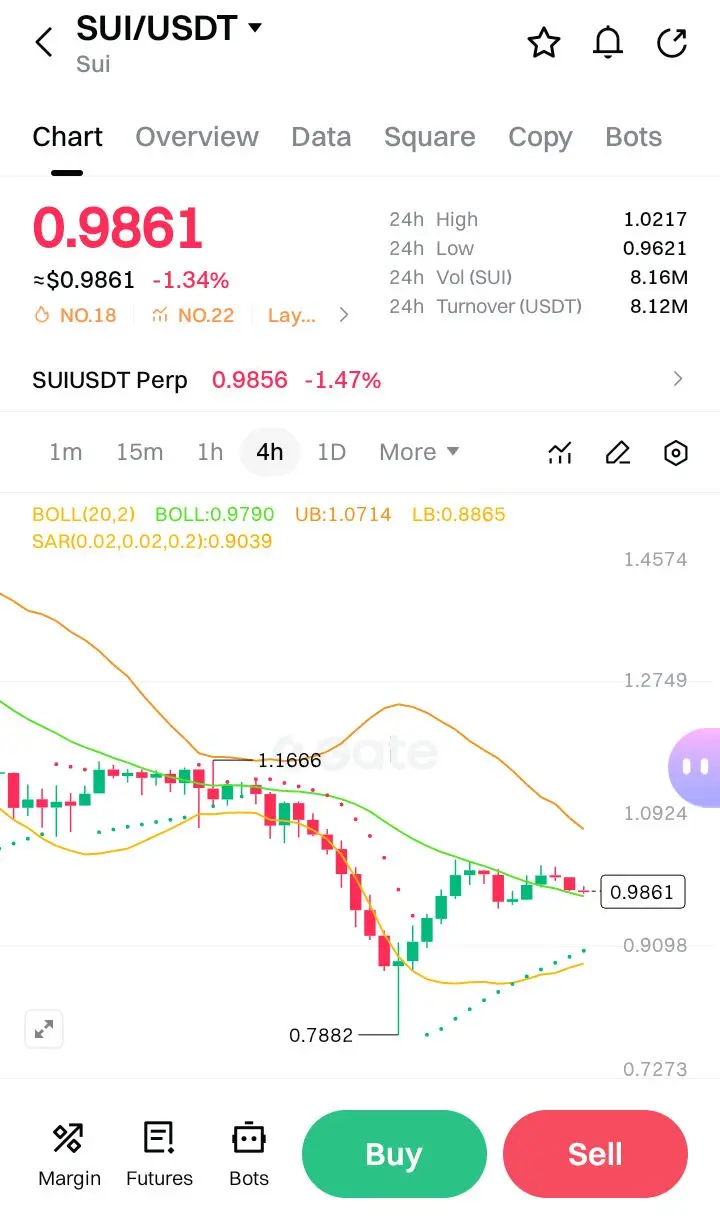
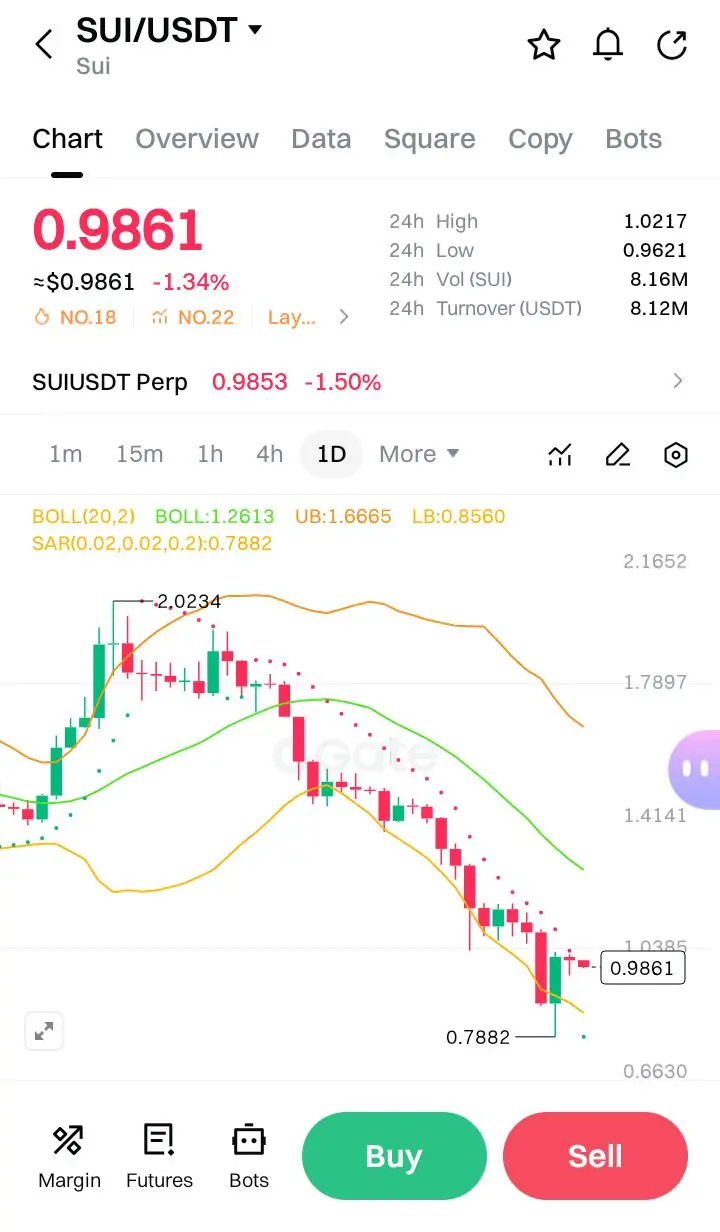
$SUI #CryptoSurvivalGuide
Multi-timeframe Analysis of the SUI/USDT market and formulate a trade plan using the Gap Retest Strategy. The data shows different technical indicator values, implying the charts are from various timeframes (e.g. 1H, 4H).
In-Depth K-Line & Market Situation Analysis
1. Overall Market Context (Higher Timeframe - Likely 4H/1D):
· Trend: The price is in a clear short-term downtrend. This is confirmed by:
· The Parabolic SAR (SAR) dots are above the price candle on all visible charts, indicating a bearish trend.
· The price is consistently trading at or below the midd
SUI-2,75%

- Reward
- 2
- Comment
- Repost
- Share
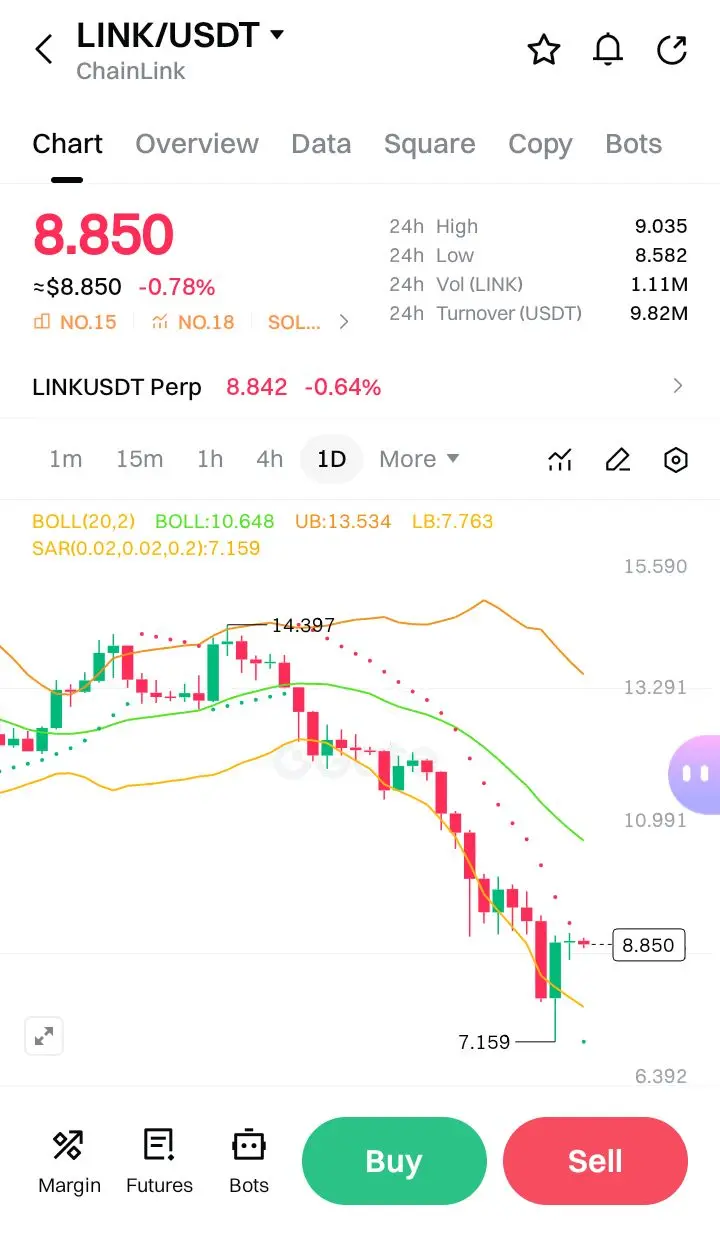
$LINK #GateSquareValentineGiveaway
here is an in-depth technical analysis of the LINK/USDT chart using the displayed indicators and price action.
1. Overall Trend: Strong Downtrend
The chart's primary feature is a pronounced and sustained downtrend. The price has fallen sharply from a high near 14.397 to the current level around 8.85. This represents a decline of over 38%.
· Visual: The candlesticks are predominantly red (bearish) and are making consistently lower lows and lower highs.
· Indicator Confirmation: Both primary indicators (Bollinger Bands and Parabolic SAR) strongly confirm the
LINK-2,37%

- Reward
- 2
- 1
- Repost
- Share
EqunixHub:
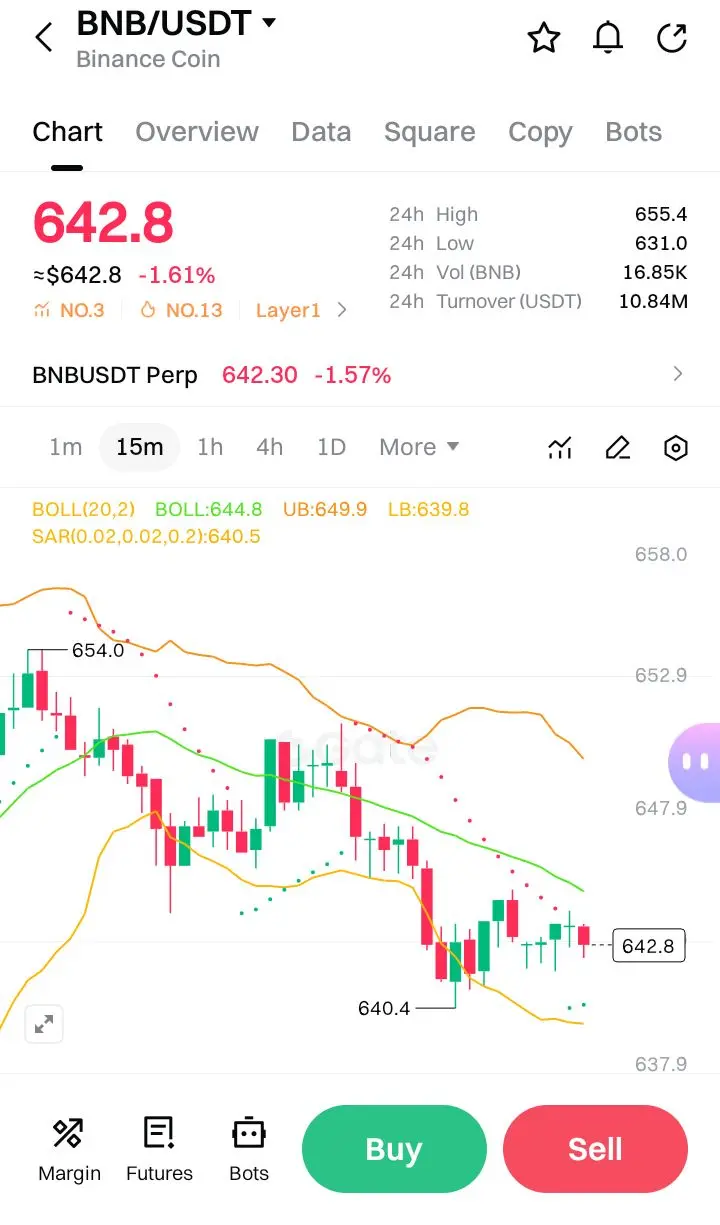
amaxing article hope you print handsome profit$BNB #CryptoSurvivalGuide
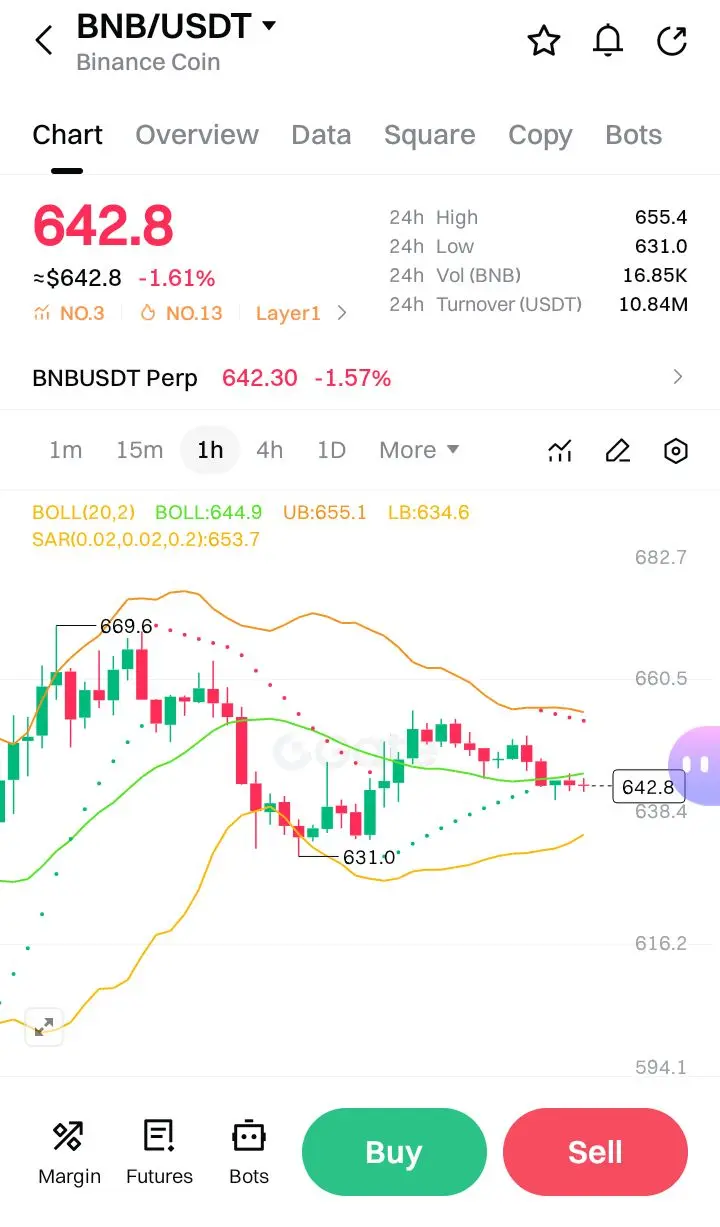
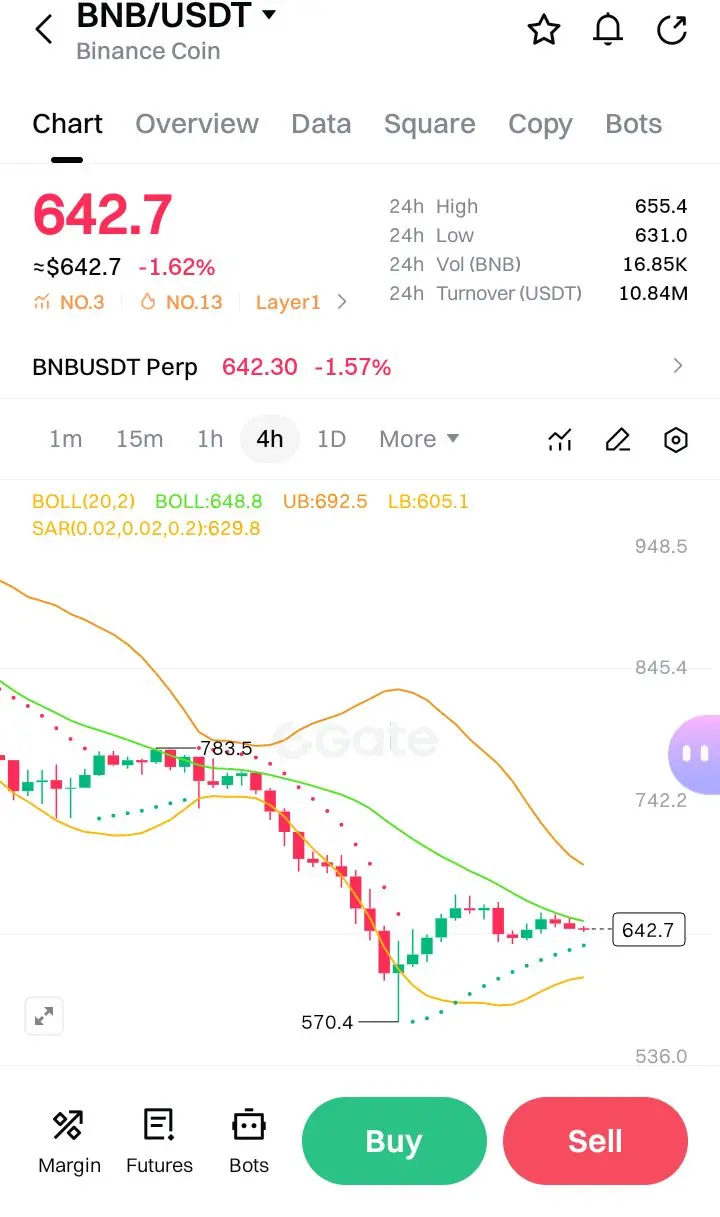
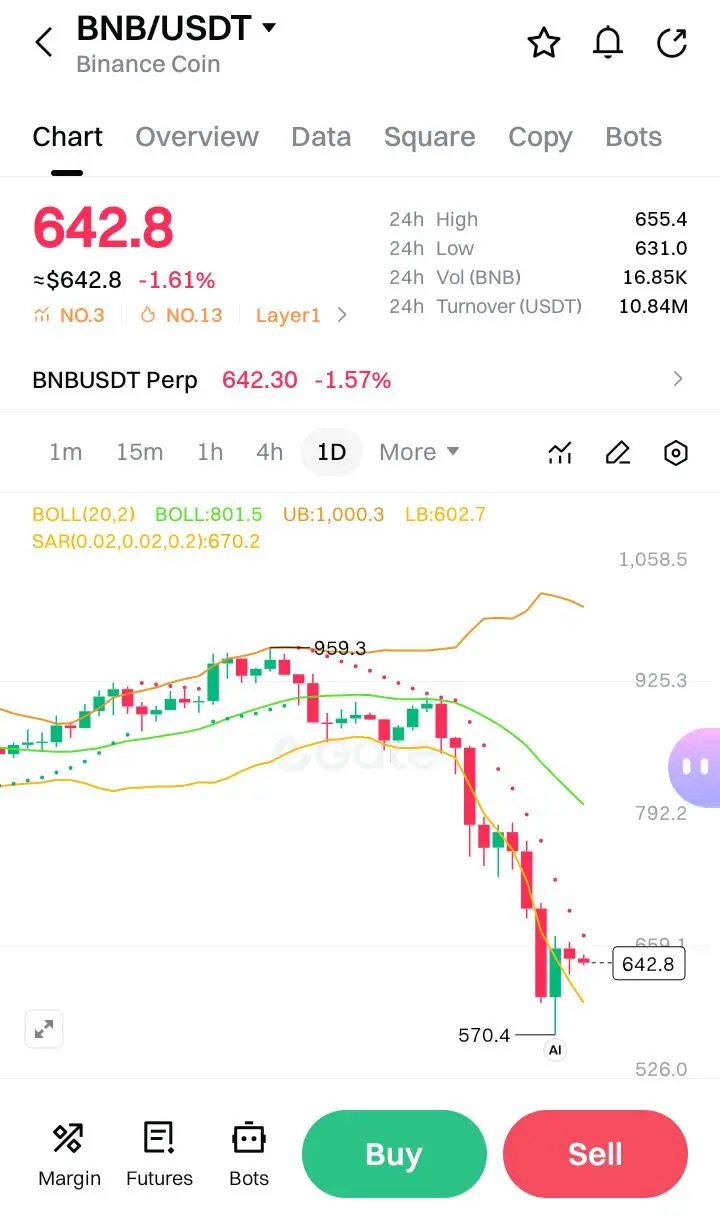
BNB/USDT Professional Chart Analysis & Trade Plan
📊 K-Line Analysis
The daily and 4-hour charts show a clear bearish structure. Price has broken below the middle Bollinger Band (BOLL) across multiple timeframes, indicating selling pressure. Recent candles show lower highs and lower lows, with the current price hovering around $642.8, down -1.61%. The 1-hour and 4-hour charts display bearish engulfing patterns and long upper wicks, signaling rejection at higher levels.
📈 Volume Analysis
24-hour volume is 16.85K BNB with a turnover of $10.84M USDT. This volume is bel
BNB-1,8%
- Reward
- 2
- 1
- Repost
- Share
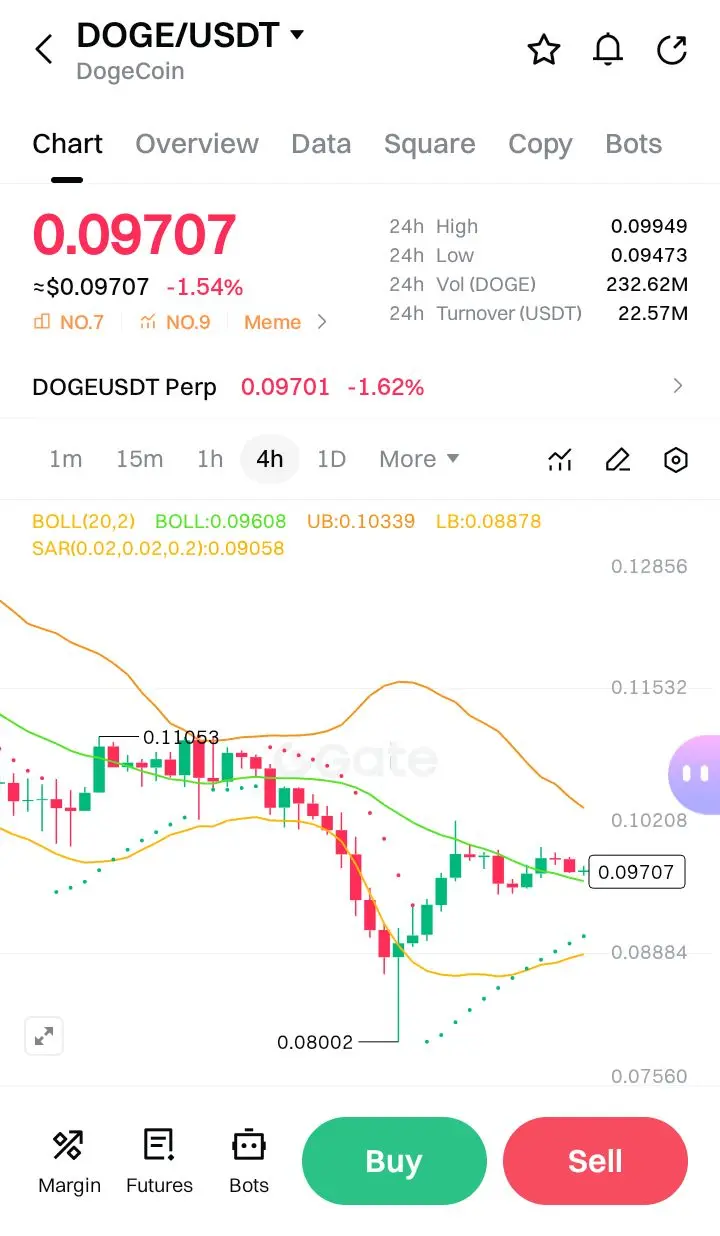
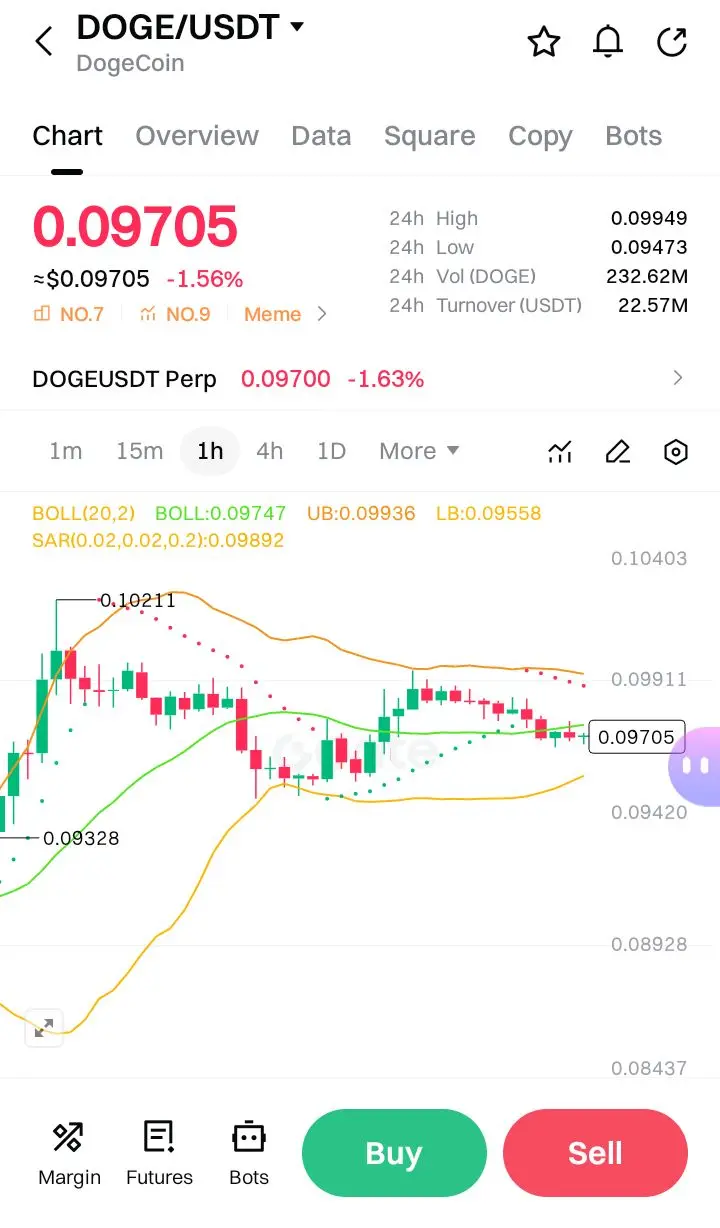
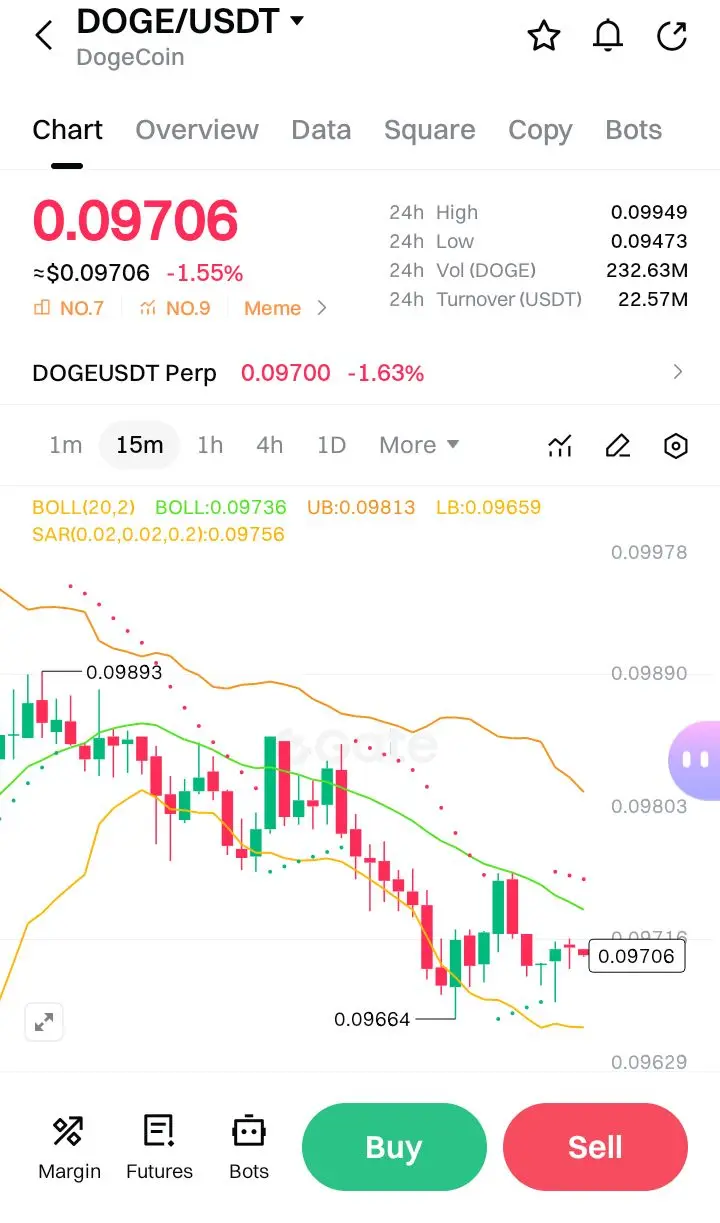
$DOGE #GateSquareValentineGiveaway
🐕 DOGE/USDT Trade Plan: The Compression Breakout;
This Article is Valentine Gift to Gate square users,
"Tight coils spring the farthest – Doge is winding up."
📊 CHART SYNTHESIS & KEY LEVELS
DOGE is consolidating after a dip. Key unified observations:
· Price: ~0.09705
· 24H Range: 0.09473 (Low) — 0.09949 (High)
· Bollinger Bands (20,2):
· Mid: ~0.09730
· Upper Band (UB): ~0.09936
· Lower Band (LB): ~0.09659
· SAR: Flirting near price (0.09756), turning from resistance to potential support.
· Volume: 232.62M DOGE / $22.57M USDT — moderate activity.
P
DOGE-1,45%
- Reward
- 2
- Comment
- Repost
- Share
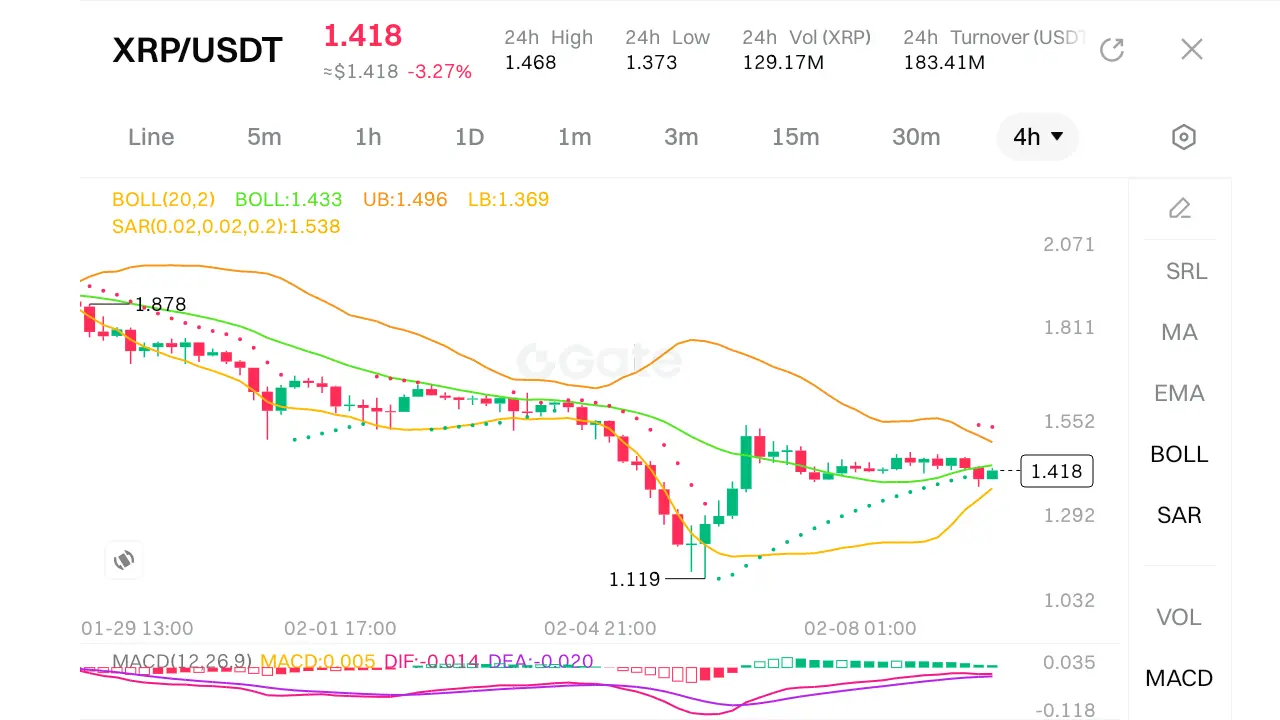
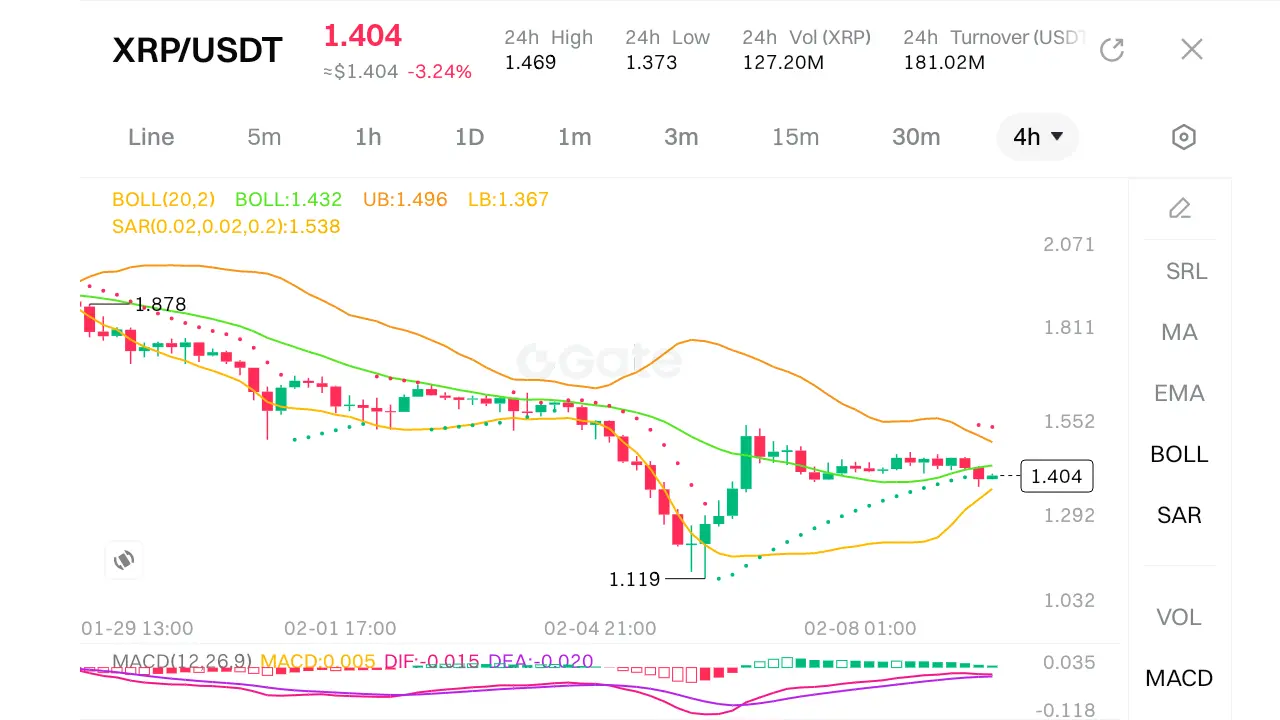
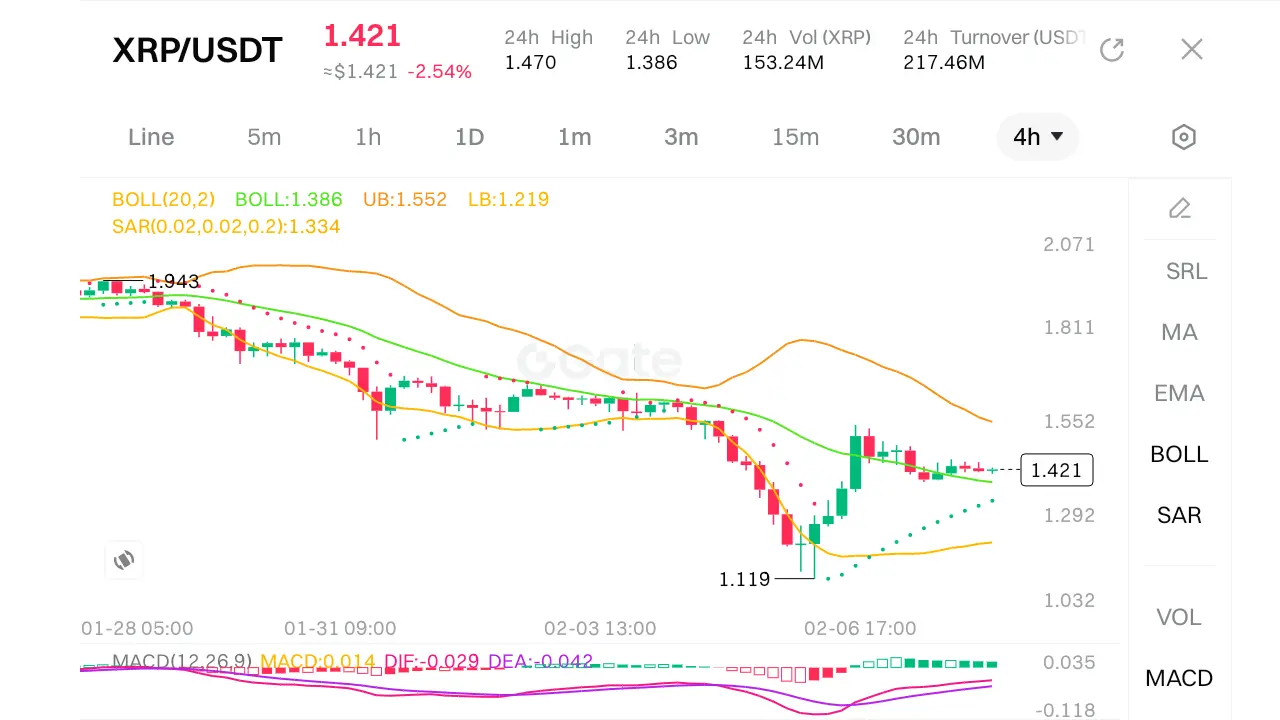
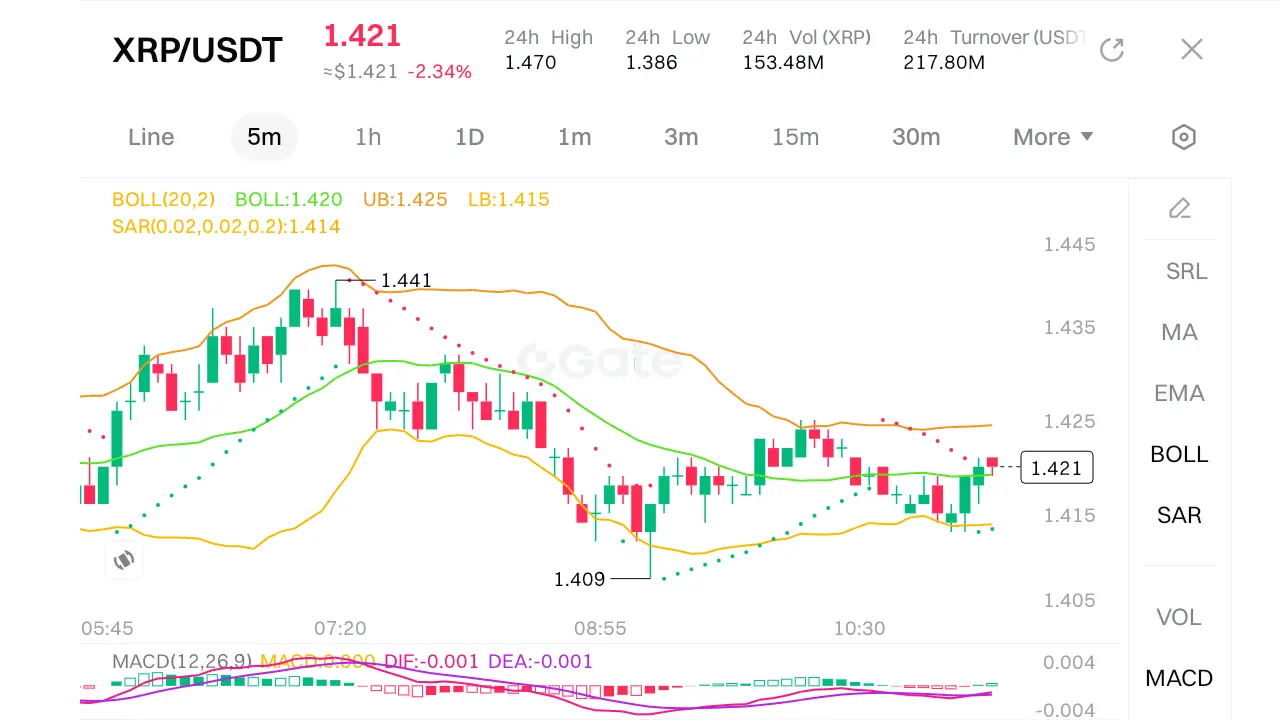
$XRP #CryptoSurvivalGuide
Here is a step-by-step plan for trading XRP/USDT using a multi-timeframe approach focused on liquidity sweeps, fair value gaps (FVG), and a 1:3 risk-to-reward ratio.
Trading Strategy for XRP/USDT
1. 4H Liquidity Analysis
· Key Levels (from 4H chart):
· Resistance: 1.552 (Upper Bollinger Band)
· Support: 1.386 (24H Low & Middle Bollinger Band) and 1.334 (SAR level)
· Trend Context:
· Price (1.421) is above the SAR (1.334), suggesting a bullish bias on 4H.
· However, MACD shows a bearish crossover (DIF < DEA), indicating potential short-term weakness.
· The 4
XRP-1,77%
- Reward
- 2
- Comment
- Repost
- Share
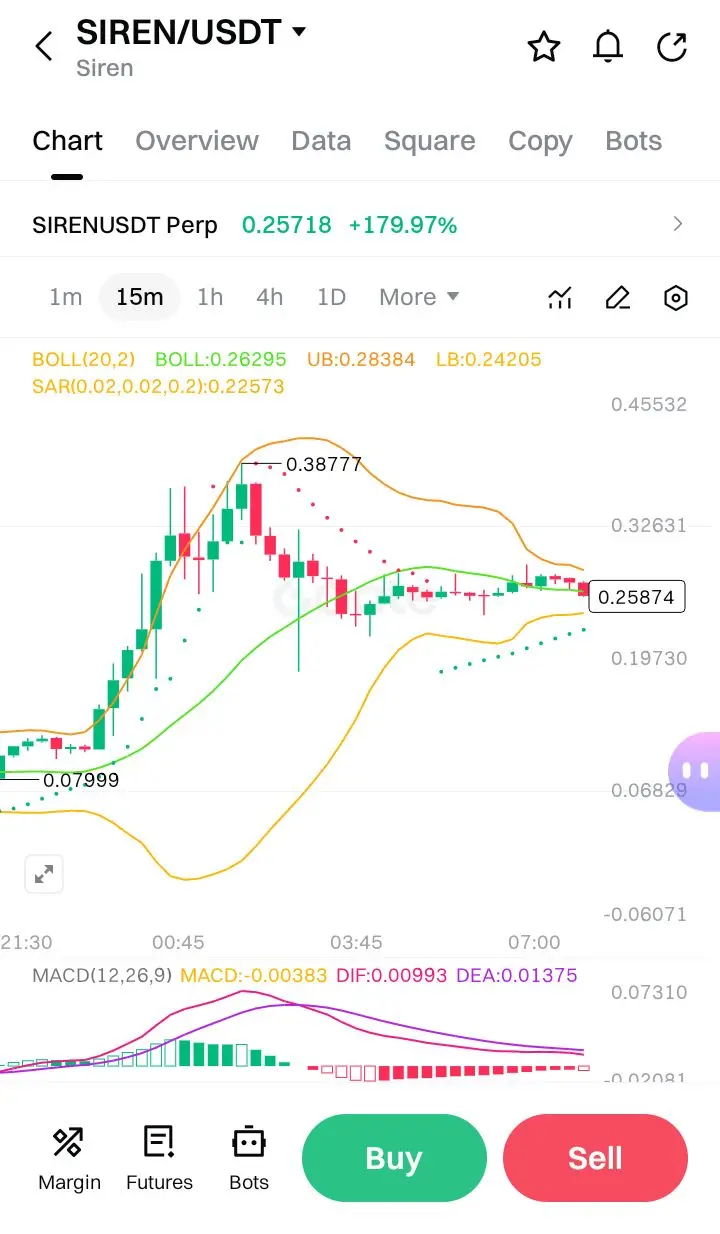
$SIREN #BuyTheDipOrWaitNow? Here is a comprehensive, in-depth K-line analysis of the SIREN/USDT perpetual futures chart.
The analysis covers the current technical setup, indicator readings, and multiple potential future scenarios.
1. Current Chart Overview & Context
· Instrument: SIRENUSDT Perpetual Futures.
· Current Price: 0.25718 USDT.
· Extreme Short-Term Move: The chart displays a massive +179.97% surge. This indicates a highly volatile, likely news-driven or breakout event, moving from a very low base (potentially around 0.09).
· Visible Candles: The chart shows a sharp rally, a pullba
SIREN-0,07%

- Reward
- 3
- 3
- Repost
- Share
AYATTAC:
Buy To Earn 💎View More
Trending Topics
View More241.73K Popularity
55.11K Popularity
28.09K Popularity
21.83K Popularity
19.34K Popularity
Pin