Trade
Basic
Futures
Futures
Hundreds of contracts settled in USDT or BTC
TradFi
Gold
Trade global traditional assets with USDT in one place
Options
Hot
Trade European-style vanilla options
Unified Account
Maximize your capital efficiency
Demo Trading
Futures Kickoff
Get prepared for your futures trading
Futures Events
Participate in events to win generous rewards
Demo Trading
Use virtual funds to experience risk-free trading
Earn
Launch
CandyDrop
Collect candies to earn airdrops
Launchpool
Quick staking, earn potential new tokens
HODLer Airdrop
Hold GT and get massive airdrops for free
Launchpad
Be early to the next big token project
Alpha Points
Trade on-chain assets and enjoy airdrop rewards!
Futures Points
Earn futures points and claim airdrop rewards
Investment
Simple Earn
Earn interests with idle tokens
Auto-Invest
Auto-invest on a regular basis
Dual Investment
Buy low and sell high to take profits from price fluctuations
Soft Staking
Earn rewards with flexible staking
Crypto Loan
0 Fees
Pledge one crypto to borrow another
Lending Center
One-stop lending hub
VIP Wealth Hub
Customized wealth management empowers your assets growth
Private Wealth Management
Customized asset management to grow your digital assets
Quant Fund
Top asset management team helps you profit without hassle
Staking
Stake cryptos to earn in PoS products
Smart Leverage
New
No forced liquidation before maturity, worry-free leveraged gains
GUSD Minting
Use USDT/USDC to mint GUSD for treasury-level yields
More
MissKitty
No content yet
Pin
MissKitty
Broadcast time (Monday to Friday randomly) at 21:24. Check the market, chat about life.
View Original
- Reward
- 9
- 6
- Repost
- Share
Z77 :
:
HelloView More
Did you follow the advice given in the afternoon?
View Original
- Reward
- 1
- Comment
- Repost
- Share
Today’s Ethereum Trading Sentiment
Bull to bear ratio 79% vs 21% (Bullish sentiment accounts for 79%).
Interpretation: Market sentiment is extremely bullish, which is often a warning sign (retail investors are overly long). Once the trend reverses, it can lead to “longs hitting longs” (liquidations and stop hunts).
Current trend: Short-term bullish (uptrend), with price moving along the upper band of the Bollinger Bands.
Key levels:
Resistance: 1,981.58 (Bollinger Band upper band) and 1,987.00 (previous high).
Support: 1,951.71 (Bollinger Band middle band) and 1,933.96 (SAR indicator).
Bullish
ETH1,39%

- Reward
- 2
- 1
- Repost
- Share
Z77:
Happy New Year! Nothing special to give, so I'll give you two phrases: May everything go smoothly for you and may you earn more US dollars. Wishing you all the best and more Bitcoin earnings, prosperity and more British pounds, with the sky above and the earth beneath, gold and silver covering the ground, and your account filled with USDT every day. Yay✌🏻✌🏻✌🏻✌🏻✌🏻✌🏻✌🏻🌍 The underlying logic of the trading market: Stop obsessing over "main forces," understanding these points is the key to clarity!
Many traders are deeply convinced by the "main force superstition," attributing rises to "main force driving up" and falls to "main force dumping," but they overlook the fundamental laws of market operation. In fact, the market logic explained in the video contains many truths close to practical trading, but we also need to view it dialectically:
✅ These perspectives hit the core truth of the market
1. The market is a collective behavior, not a stage controlled by
View OriginalMany traders are deeply convinced by the "main force superstition," attributing rises to "main force driving up" and falls to "main force dumping," but they overlook the fundamental laws of market operation. In fact, the market logic explained in the video contains many truths close to practical trading, but we also need to view it dialectically:
✅ These perspectives hit the core truth of the market
1. The market is a collective behavior, not a stage controlled by

- Reward
- 4
- 2
- Repost
- Share
Z77:
Clicked, night owl, trying to sleep early, failed on the first day.View More
The core of trading is not technology. What do you think?
View Original- Reward
- 14
- 9
- Repost
- Share
AccMillion :
:
Many 666, 666666666666666666666666666666666666666666666666666666666666666666666666666666666666666666666666666666666666666666666666666666666666666666666666666666666666666666666666666666666666666666666🤪🤪🤪🤪🤪🤪🤪🤪🤪🤪🤪🤪🤪🤪🤪🤪View More
Subjective Decision-Making vs System Rules: In the market, which do you trust more? Essentially, these are two different ways of thinking. Understanding them is to find the path that suits you best.
View Original- Reward
- 2
- Comment
- Repost
- Share
Last night, I placed a short position at 2130 with a stop loss at 2150. Unfortunately, I reduced my position at 2080, but ended up closing everything out. I'm feeling quite upset. Currently, I have a long position at 2009. Personally, I think the market is in a consolidation phase and hasn't broken out into a trend, but 2153 is very likely a short-term high!
View Original- Reward
- 2
- 1
- Repost
- Share
Z77:
🥰 Good bossThe "Trap" and Proper Usage of Support and Resistance Levels
Especially in a bull market, don't get caught by "standard drawing lines." Here is a key summary:
1. The Root Cause of Most People's Losses: Drawing Support and Resistance Levels "Too Precisely"
- In a bull market, what you think is a "support level" is actually the area where retail investors' consensus is most concentrated.
- Major players will use these "standard support levels" to shake out traders: you buy, then it drops; after you cut losses, it rises again. It's not bad luck, but your drawing exposes retail positions, turning
View OriginalEspecially in a bull market, don't get caught by "standard drawing lines." Here is a key summary:
1. The Root Cause of Most People's Losses: Drawing Support and Resistance Levels "Too Precisely"
- In a bull market, what you think is a "support level" is actually the area where retail investors' consensus is most concentrated.
- Major players will use these "standard support levels" to shake out traders: you buy, then it drops; after you cut losses, it rises again. It's not bad luck, but your drawing exposes retail positions, turning

- Reward
- 5
- 5
- Repost
- Share
Korean_Girl:
Sister Come and join my live streamView More
Multiple positions closed, today is a rest day.
View Original- Reward
- 4
- Comment
- Repost
- Share
No resistance means support. If it can't hold, then it's a breakdown. The market has no guaranteed winning strategy, only a good mindset. Don't compare yourself to those with unlimited bullets! Staying alive is the most important thing. Go all-in aggressively, you're a gambling dog! Dogs still have owners, but you don't.
View Original- Reward
- 2
- Comment
- Repost
- Share
Best Entry: 2060 ~ 2065 USDT (Bollinger middle band support, above SAR, strong support level)
- Emergency Entry: If there is no pullback, directly break through 2090 with increased volume and stabilize, then follow with a light position at 2090
Take Profit Levels (two-stage take profit to secure gains)
- First Take Profit (short-term 70% position): 2105 USDT
- Second Take Profit (remaining 30% position): 2113 USDT (Bollinger upper band strong resistance, likely to pull back)
Fixed Stop Loss: 2040 USDT
(SAR support level + previous low resonance, breaking below this signals a failure of the bul
View Original- Emergency Entry: If there is no pullback, directly break through 2090 with increased volume and stabilize, then follow with a light position at 2090
Take Profit Levels (two-stage take profit to secure gains)
- First Take Profit (short-term 70% position): 2105 USDT
- Second Take Profit (remaining 30% position): 2113 USDT (Bollinger upper band strong resistance, likely to pull back)
Fixed Stop Loss: 2040 USDT
(SAR support level + previous low resonance, breaking below this signals a failure of the bul
- Reward
- 2
- 1
- Repost
- Share
MissKitty:
Never hold a heavy position, especially not all at once. Be cautious with your investments and avoid over-concentrating your assets in a single area. Diversify your portfolio to reduce risk and ensure long-term stability. Remember, prudent management is key to successful investing.ETH 2-hour/4-hour in a strong rebound within a bearish trend, 15-minute is dominated by short-term bulls; the larger cycle has not reversed, the smaller cycle is relatively strong. The current position is a critical zone between bulls and bears. Only a break above 2114 opens up space; a break below 1992 means the rebound will end immediately.
1. 4-Hour Cycle (Trend Cycle, Determine the Main Direction)
1. Trend Qualitative
The 4-hour chart still shows a recovery rebound after a decline, without breaking through the previous downtrend channel. It is a rebound, not a reversal. The large-scale bea
1. 4-Hour Cycle (Trend Cycle, Determine the Main Direction)
1. Trend Qualitative
The 4-hour chart still shows a recovery rebound after a decline, without breaking through the previous downtrend channel. It is a rebound, not a reversal. The large-scale bea
ETH1,39%

- Reward
- 1
- Comment
- Repost
- Share
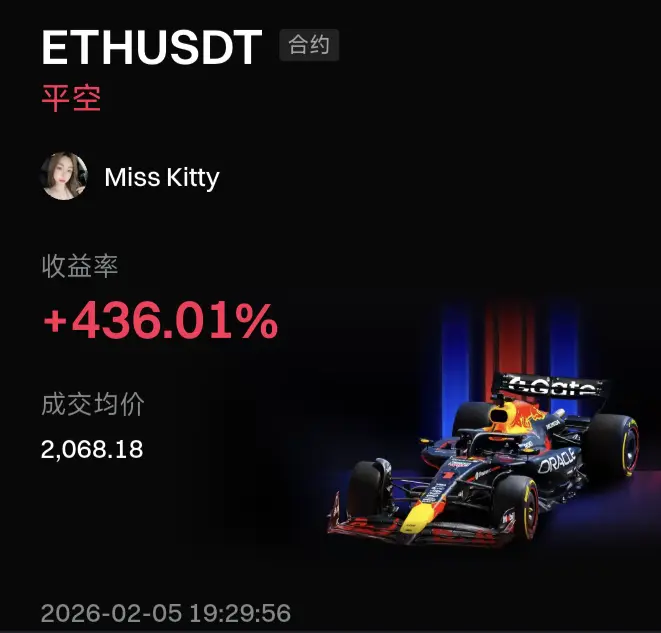
Yesterday's short positions have been closed. The market moved favorably, and I decided to exit my positions to lock in profits. Looking ahead, I will continue to monitor the market closely and prepare for new opportunities.
View Original- Reward
- like
- Comment
- Repost
- Share
Haha, the lush green looks really good 👀
View Original
- Reward
- 1
- 3
- Repost
- Share
IDon'tWantToEatInstantNoodles. :
:
What is this! MissView More
1. The Hidden Logic of Funding Rates
Perpetual contracts' funding rates are not fixed; they are adjusted every 8 hours based on the comparison of market long and short forces. When the funding rate is positive, longs pay shorts; when negative, the opposite. An interesting fact is that if the funding rate remains significantly positive for a prolonged period, it often indicates overheated market sentiment and could be a short-term top signal, and vice versa.
2. The "Domino Effect" of Contract Liquidations
In extreme market conditions, mass forced liquidations can create a "liquidation waterfall
View OriginalPerpetual contracts' funding rates are not fixed; they are adjusted every 8 hours based on the comparison of market long and short forces. When the funding rate is positive, longs pay shorts; when negative, the opposite. An interesting fact is that if the funding rate remains significantly positive for a prolonged period, it often indicates overheated market sentiment and could be a short-term top signal, and vice versa.
2. The "Domino Effect" of Contract Liquidations
In extreme market conditions, mass forced liquidations can create a "liquidation waterfall
- Reward
- 1
- 2
- Repost
- Share
Peige188:
Hold on tight, we're about to take off 🛫View More
Technical Indicators:
- Bollinger Bands (BOLL): The current price (1,913.25) is close to the lower band (1,813.02), indicating a potential oversold rebound.
- SAR Indicator: The current value is 1,820.14, with the price above the SAR indicator, suggesting short-term technical support.
- Bullish and Bearish Forces: Buy volume (B) accounts for 71%, sell volume (S) accounts for 29%, showing a short-term market bias towards the bulls, but this sentiment could reverse quickly.
Trading Risk Reminder:
- Funding Rate: The current funding rate is -0.0006%, indicating a bearish market bias. Long positio
View Original- Bollinger Bands (BOLL): The current price (1,913.25) is close to the lower band (1,813.02), indicating a potential oversold rebound.
- SAR Indicator: The current value is 1,820.14, with the price above the SAR indicator, suggesting short-term technical support.
- Bullish and Bearish Forces: Buy volume (B) accounts for 71%, sell volume (S) accounts for 29%, showing a short-term market bias towards the bulls, but this sentiment could reverse quickly.
Trading Risk Reminder:
- Funding Rate: The current funding rate is -0.0006%, indicating a bearish market bias. Long positio

- Reward
- 1
- Comment
- Repost
- Share
Basic Knowledge
Contract K-Line Practical Quick Reference Checklist
I. Four Basic Elements of K-Line
- Opening Price: The first transaction price at the start of the period
- Closing Price: The last transaction price at the end of the period
- Highest Price: The highest transaction price within the period
- Lowest Price: The lowest transaction price within the period
- Bullish Candle: Close > Open, buyers dominate; Bearish Candle: Close < Open, sellers dominate
- The longer the real body, the stronger the trend momentum; the longer the shadow, the more intense the battle between bull
View OriginalContract K-Line Practical Quick Reference Checklist
I. Four Basic Elements of K-Line
- Opening Price: The first transaction price at the start of the period
- Closing Price: The last transaction price at the end of the period
- Highest Price: The highest transaction price within the period
- Lowest Price: The lowest transaction price within the period
- Bullish Candle: Close > Open, buyers dominate; Bearish Candle: Close < Open, sellers dominate
- The longer the real body, the stronger the trend momentum; the longer the shadow, the more intense the battle between bull
- Reward
- 3
- 1
- Repost
- Share
MissKitty:
Many friends are not even clear on the basic knowledge.Just a little more, short-term profits can be taken now.
View Original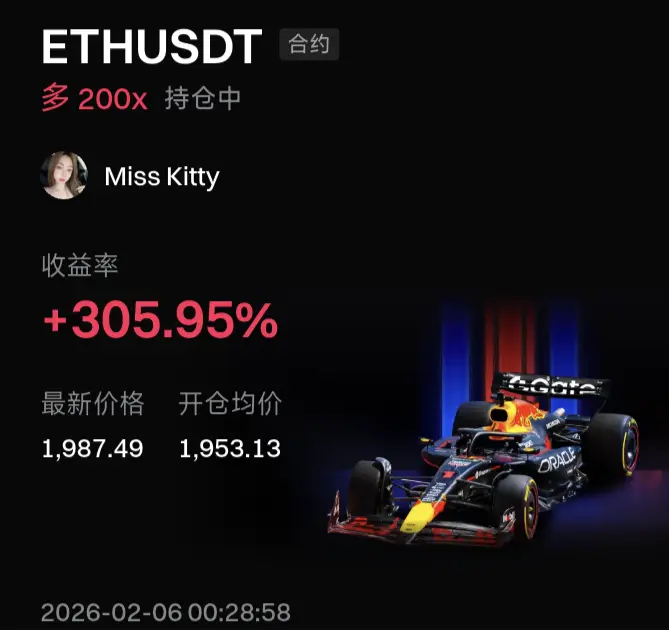
- Reward
- 2
- 2
- Repost
- Share
天才小熊猫Y落袋为安�� :
:
Are you broadcasting tonight?View More
短线的止盈了~
The short-term profit-taking has been completed, and now it's time to reassess the market conditions before making further moves.
View OriginalThe short-term profit-taking has been completed, and now it's time to reassess the market conditions before making further moves.
- Reward
- 1
- 1
- Repost
- Share
MissKitty:
Need to improve your own perspective.When I don't make a sound, I'm quietly making money(^ω^)💰
View Original

- Reward
- 1
- 4
- Repost
- Share
MissKitty:
I am an entertainment streamer 😏 I enjoy sharing my daily life, playing games, and chatting with my fans. Whether it's funny moments, challenges, or just relaxing, I love connecting with everyone and making people smile. Join me for fun and entertainment!
View More
The business has closed for today. Please come back tomorrow.
View Original
- Reward
- 1
- Comment
- Repost
- Share